These release notes list feature changes for the current release of Stella Architect, iThink, Stella Professional, and Stella Designer. Feature changes are also shown for previous versions of the software. There is a list of Known Issues for the current software release as well as a version by version detailing of Defects Fixed.
There is now an option to work with .stmz files which bundle the model, run file (.isdb) as well as all data, graphics, and other supporting files together into a single archive. .This archive (with extension .stmz) can be opened directly in Stella on other computers without needing to send any additional files, and also without having to expand a zip archive. Use the File Menu to create the .stmz file from a .stmx or .itmx model. Once created it can be opened, modified, and saved just like any other model. There are special considerations for models that export data, or rely on Excel files as inputs as is discussed in Data Folder.
Interfaces can now provide a Data Manager(Interface) that allows users to hide, show, delete, and rename runs. It also allows users to use the settings from previous runs to create new runs. This makes it much easier for interface users to compare results across runs, manage the amount of information displayed in comparative graphs and tables, and refine experiments.
Button Actions (Interface) now include a choice to import data as a run on the interface. This, combined with a new option to export formatted for import on the export data and export tagged variables actions make it possible to preserve results across different uses of an interface.
The Placeholder and Array selectors on the interface now update as you move through the selection list just as they do on he model. This provides a powerful way to quickly scan through a large number of graphs. See Selector for context.
There is now an option to compute the full likelihood rather than just the error terms when Defining Calibration Payoffs. This allows inclusion of the weights as a calibration parameter.
Computing Loops that Matter for large models has been sped up considerably.
You can now change the color of sliders for both the regular and stylized Slider (Interface). The color itself is set on the Styles Tab.
The Sensitivity Parameters dialog (Model Only) will now work smoothly with more than 5,000 runs.
The Equation Viewer will now use the more concise format for non apply to all equations with some apply to all elements supported in the Equation Tab.
When Creating CLDs there is now a Virtual Assistant that lets you harness the power of AI to speed and improve the development of coherent and completes Causal Loop Diagrams. The assistant can help in the identification of link polarities and the reasoning underling their existence, while at the same time leaving you in charge of making the final decision on what gets included. It has also been organized in a way that makes it easy to experiment with different ways of forming queries to improve the resulting diagram.
We have made a number of improvements to the computational engine underlying Stella that will decrease the time required for simulation by 20% to 80% depending on the model. Speed has been improved both for the desktop and published sims, and does not require any changes to models, though making sure that nothing was inadvertent marked for FIFO Conveyor Computation can improve speed.
The setup for specifying time labels as dates has been simplified and improved to provide exact dates for models running in weeks and days. It is also easy now to have dates come out on the 15th and end of months as well as the last day of years and quarters. This is controlled from the Set Time Label Format dialog box. Models with existing time labels will be automatically translated to the new format, and retain their old settings to enable backward compatibility (unless the formats are edited). Settings added using the new format will not be recognized in older versions of Stella.
For interfaces with many pages, it is now possible to organize those pages into sections, much like stories are organized. This makes it easier to navigate during development and can be helpful when multiple people are working on an interface. Sections are managed from the Pages Panel (Interface). Sections are not backward compatible, and pages withing a section will be lost if a model is opened and saved in an older version of Stella.
Variables appearing in the Parameter Control Panel can now be pinned to they will not be removed after resetting them to their base or imported values. The control panel has also been improved to maintain synchronization with changes made to parameters on the interface, setting values during Stella Live or executing on demand imports. The pinned variables will be saved with the model. Older versions of Stella will not recognize the pinned status and not preserve it on save.
When an array is not marked as apply to all, it is now possible to have individual dimensions marked as apply to all. This is useful when the equations are different between elements of one dimension, but the same for all elements of another dimension. There is no need to enter equations that are the same more than once. This is set in the Equation Tab and is discussed further in Creating Arrayed Variables. Setting this will not hurt backward compatibility, but the setting will be lost for models saved in older versions of Stella.
The Confidence Graph when showing the distribution across array elements now has an option to be comparative. This overlays one set of values on another which, with partial transparency, allows a comparison of the outcomes across different scenarios.
When defining payoffs with the Payoff Specs panel the weights associated with the payoff elements can now be specified as variables. This allows for calibration over the payoff weights as well as the incorporation of time varying weights when appropriate.
The Context Menu on the Results Panel now has an option to set the time format. This makes it easier to switch between time label selections without loosing any restriction to the displayed time range that has been set.
The Accumulate option in the Results Panel now starts from the first time in the selected range rather than the beginning of the run. This makes it easier to compare two runs or variables over a subset of the full range.
When simulating during story telling there is now an option to simulate the entire model rather than just the visible structure. This is useful when the purpose of the displayed structure in the story is to highlight it relative to the overall observed dynamics. The option is set in the Story Settings Properties Panel. This option is not backward compatible to older Stella versions.
In the The CLD Window the Mode Toolbar now includes an option for Explore Mode. In this mode the connector handles are hidden, and nothing can be moved on the CLD. This makes it easier to display clean diagrams without copying and pasting them into another piece of software.
The vertical line in a graph, specified in the Graph Settings Properties Panel, now has an option the set its color directly. This setting will not be recognized in older Stella versions.
The Create Import Template dialog box has a new option that allows you to choose between using both X and Y values for graphicals or only the Y values.
It is now possible to insert variable values into text boxes and annotation by including a variable name and optional time enclosed in ${}. The value of the variable will be displayed using the number formatting options, including any number text mappings (see Manage Number-Text Mappings dialog box) set up for the variable. You can choose variables from the Text Box Properties Panel, or the Annotation Button (Interface) properties to include.
The Custom Shape (Model) tool allows you to place arbitrary shapes on a causal loop or model diagram in order to highlight elements of the diagram. This makes it easier to present complex diagrams by breaking them up into a number of visual components.
You can now include units of measure in a numeric display, and also control text alignment. See Numeric Display Properties and Styles Tab for details.
The Array Output (Interface) object allows you to display all elements of an array on the interface. This is a quick way to provide a tabular representation of values at a point in time.
There is now an option to display a vertical bar and text in a graph to mark an important time point such as the end of historical values. When scrubbing on graphs it is also possible to set a separate time format so that the scrubbing can provide more precision than the labels. This is especially valuable when using formatted labels. See Graph Settings Properties Panel and Context Menu for more details.
In addition to specifying a time distribution for inflows to a conveyor using a graphical, you can also specify them using a one dimensional slice of an array. This allows the array distribution to be specified dynamically. For more information see Spreading Conveyor Inputs for details.
Connectors now update their angles when moving structure making the creation of large circles much less likely.
You can now use Placeholders in Graphical input (Interface) as long as every variable included in the placeholder is a graphical.
If you have an equation with a number of missing or extra inputs there is now a button to fix all of them at ounce instead of having to click for each one separately. This is very handy when copying and pasting variables that are variations on an existing variable.
When using LTM with a model that has multiple modules with distinct set of loops the loop sets are now prefixed with the module name to make it easier to determine which is which. See Loops Panel for more discussion.
In models, when in analyze mode, rather than having to right click on a loop label and select highlight you can simply click on the loop label. Clicking again will turn off highlighting. See Loop Labels for discussion.
The Shape (interface) object now has an option to block clicks on objects below it. This allows you to block user actions in contexts where they would not make sense.
When you reorder array elements on a variable that is not apply-to-all the equations will be reordered rather than being cleared.
If you shift click to select a sequence of numeric inputs (or group or array inputs) and then right click on them you can set the tab order to match the selection sequence. See Context Menu.
These Release Notes will now open automatically the first time you start software that has been upgraded to the most recent version. They include changes made in the most recent version, as well as a running list of all changes going back to version 1.0.1. The videos (denoted by ![]() ) provide brief introductions to many of the new features.
) provide brief introductions to many of the new features.
It is now possible to label connectors to increase the readability of diagrams, especially Causal Loop Diagrams. This is done from the Styles Tab for Building Blocks. The polarity symbol can also be set to appear in the middle of the connector rather than just at it head. See Connectors for more discussion.
There is now a module tool available when Creating CLDs. This provides more flexibility in organizing your diagrams.
When you add a Loop Score variable (see Converters) to a model it is now possible to configure it to have the same appearance as Loop Labels. Loop Score variables are normally created from the Loops Panel and their appearance is controlled from the Equation Tab as List.
Loop and Pathway Score variables also now allow you to highlight the loop or pathway that they represent the same way you can highlight Loop Label contents from the Context Menu or the panel.
It is now possible to configure graphs to display a window of time (for example 10 weeks), with the final time in that window controlled from the Run Toolbar. This option is set in the Graph Settings Properties Panel.
The Results Panel now has an option to accumulate values. This provides a quick way to see the total amount that flows add up to and can be helpful when reviewing and comparing noisy data.
It is also possible to lock the displayed time span allowing you to zoom in on different time ranges and then sliding the window across the full time range, similar to the sliding time window in graphs.
When setting up Sensitivity Analysis the scales and ranges setting for variables will be used to set minimum and maximum values for selected variables. If you do not override these values, and later change the variable on the Scales and Ranges Tab of the properties panel the updated values will be used.
When a flow is marked as time stamped on the Equation Tab there is now an option to set then age of the material entering to something other than 0. This makes it easier to configure models using Attribute and Cycle Time Tracking.
These builtins will now compute much more quickly for models that simulate for many DTs.
The label is shown in the Parameter Control Panel . This makes it easier to understand the source of the value.
We have added a Loops panel to Casual Loop Diagrams that identifies all of the loops in the diagram and allows you to highlight them and add Loop Labels for them. Details in CLD Loops Panel.
You can now attach a name to Loop Labels that will appear at the bottom, this is in addition to the text that appears inside of the arrow.
The documentation on Loop Labels can now be entered in the same place as the name and marking.
Highlighting of loops based on the Loop Label now follows the format of highlighting used with Loops that Matter - the highlighted loop draws normally, while all remaining structure is grayed. In addition, it is possible to lock the highlighting of one or more Loop Labels in place allowing multiple loops to be highlighted and facilitating copying and pasting to other applications. See Loop Labels for details.
The same type of highlighting that occurs with the Loop Label can also be applied using the Context Menu which will highlight a variable and its causes or uses. The highlighted variables can be added to in order to extend the selection as broadly as desired.
In Map mode (as selected from the Mode Toolbar) as well as in The CLD Window, documentation on variables now appears on hover making it easier to see all documentation without selecting a specific variable.
The drawing of connectors into and out of name only variables has been adjusted to provide more space between the connector and the variable improving the appearance of the diagram.
The CLD Documentation Viewer provides support for documenting CLDs including listing the loop labels, variables and connectors along with other information they contain.
Polarity symbols can not be placed either next to the arrowhead or on the stem toward the source of the connector. This is controlled from Styles Tab for Building Blocks when a connector or connectors are selected.
In addition to the +/- s/o distinction for causal connections you can also choose to hide the labels themselves. This allows other conventions, such as color, to bu used in causal loop diagrams. This preference is set in the Model Settings Properties Panel and also in the CLD Style Properties Panel.
There is now a global text style for annotation that can be set on the Model Style Properties Panel and the CLD Style Properties Panel. It allows you to more easily control the appearance of Text boxes and Loop Labels.
In addition to selecting all connectors, it is now possible to select the connecters included in the current selection. This makes it easier to change colors or appearance for portions of a model. It is also possible to select connectors marked with a negative polarity, a positive polarity, or not marked with a polarity. See Edit Menu for more details.
We have extended the Find and Replace Dialog to allow changes to tags associated with a variable (and kept tag changes out of documentation changes).
It is now possible to have all constants and graphicals in an existing run set to control values in the current run. This can be done from the Load Parameters dialog. It is also possible to load parameters from sensitivity runs that are still in the Data Manager but marked partial. This does require the sensitivity be run from Version 3.7.1 or later to work correctly.
A new option on comparative tables that will show correlation values that are available in the Correlation Graph. This is set from Table Properties and is available only on the model. It is helpful for exporting values.
There is now an option on the Find window to show only variables that are module inputs (cross-level ghosts) and those that are not. This makes it easier to find where variables are coming from and ending up when working with model that have many modules.
If you try to name a variable to a name that is already used, or is a builtin function, rather than returning the original name the name you have selected will be made unique by appending a number, and remain opened for editing.
The Cycle-time builtins builtin now returns the previous value when a flow becomes 0, rather than returning 0, and also anticipates the next cycle time for arrested conveyors. This makes it more convenient to report cycle times without having to write special equations.
Right clicking on a builtin name in the equation box of the Equation Tab will now allow you to open the help entry associated with that builtin using the Context Menu.
Stella Simulator will now output any divide by 0 messages to the console, and also return 1 to indicate an abnormal completion. Previously it would finish silently and report success even through the results would be partial.
Box and whisker graphs allow you to show uncertainty over a series of realizations of an uncertain value. They, importantly, allow comparative display across different uncertain scenarios when set up across array elements as described in Box and Whisker Graph.
Confidence graphs allow you to see the spread of outcome across either multiple runs or multiple array elements. See Confidence Graph for more details.
Models that had comparative line graphs set up with the option to plot confidence values will automatically be translated into the new graph type. The option to plot confidence values no longer appears on the line graph.
Correlation graphs allow you to see the relationship over time of different variables across sensitivity runs. This is a an effective way to explore the important determinants of behavior for selected variables. See Correlation Graph for more details.
Rather than selecting graph types by clicking on a radio button, they are now selected from a dropdown list of types.
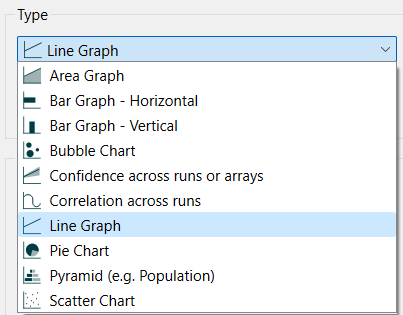
This makes it easier to see which types of graph you will be adding. See Graphs for more discussion of the different graph types.
In addition to numbers, you can also mark graph lines with letter and symbols. See Line Graph for details. The Correlation Graph also supports this.
The Line Graph also has a new option to draw series with stepwise connections between points, so that the graph lines consists only of horizontal and vertical segments with no interpolation between them. See Graph Series Property Panel for details.
To create a CLD from a set of tagged variables simply click on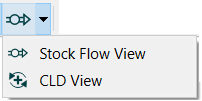 - in the Mode Toolbar. This will bring up the CLD Tag Selection dialog box which will allow you to specify which tags to use. The resulting CLD is the same as chose created using Loops that Matter as discussed in CLD Generation.
Tables and graphs, including the Results Panel, allow you display all elements of an array together. For large arrays this can be cluttered, and the new Array Selection Panel allows you to select which elements of an array you would like to see values for.
Version 3.7 contains a number of changes that make it easier to work with arrayed variables and their equations.
A CONTAINS keyword has been added that provides a quick way of testing whether the current element in an array is contained in a subrange of the array. This can simplify equations that might depend on nested IF THEN ELSE to do these tests, and also improves maintainability. See Subranges for more discussion.
Non Apply-To-All (a2a) equations now allow the use of dimension names in equations, making it easier to set multiple entries to the same equation. See Creating Arrayed Variables and Arrayed Equation editing dialog for more details.
An option has been added to the Array Editor dialog box to duplicate array elements. This allows the expansion of arrays by replicating non a2a equations from the specified source (for example repeating a constant value). See also the Array Element Duplicate dialog box.
Graphicals now have an option to repeat changes made to a y value for all following y values when changing values in a table as described in Graphical Function Tab. This makes it easier to change a number of values at once, especially on the interface.
The Graphical input (Interface) has also been extended to allow control over how the dialog first displays (graph or table) and whether the interface user can switch between them.
We have added some useful color palettes to the Global Graph Styles Properties Panel. This makes it easier to change the sequence of colors displayed in graph.
When selecting sensitivity or optimization as a button Actions (Interface) it is now possible to select which sensitivity or optimization specifications to use.
The Parameter Control Panel now allows you to reorder the entries and keep them in place as you reset inputs and after saving and reopening a model. This makes it much easier to keep track of changes that are being made in the current run.
It is also possible to control graphicals directly from this panel, in addition to controlling them from the Results Panel. This makes it possible to temporarily change a graphical without entering Stella Live or using the interface, and also keeps all the changes in one place.
The color and fill color displayed by variables can be set by tag from the Model Style Properties Panel. This allows you to customize your model appearance without changing individual variables and has the advantage that changing the tag for a variable from the Documentation Tab of the properties panel is all that is necessary to change its color.
The notation used in SUM in other array operations can now include dimension_name.* instead of just *. This removes ambiguity and allows more flexibility in operations involving differently arrayed variables. For example the expression
SUM(price_of_all_products[AllProducts.*] * (sales_dairy[AllProducts.*] + sales_soup[AllProducts.*]))
will give revenue from dairy and soup products, assuming those are included in AllProducts. Whereas
SUM(price_of_all_products[*] * (sales_dairy[*] + sales_soup[*]))
will be marked as an error requiring disambiguation. The latter expression used to compute an expression using all combination of 3 different dimensions and could be orders of magnitude bigger than expected.
See Specialized Array Manipulation for more discussion.
You can now set the font used in the dropdown for page selection of graphs and tables as described in Graph Styles Tab
Tags are text you an attach to model variable using the Documentation Tab. They allow you to search for and select using the Find window, export using the Export Data dialog box, or omit from the Equation Viewer. They make it easy to group and organize variables in any number of ways to apply different characteristics such as number formatting.
When importing data from the interface (published or on the desktop) it is now possible to set the array element display labels using Import as described in Actions (Interface). This allows customization of the interface to reflect, for example, the country under study.
In addition to being able to import display labels, you can also provide files to be imported when a button is pressed as described in Actions (Interface). These files will be available when published and can be used to load data and array element labels for different interface configurations.
When using the Model View object it is now possible to have the diagram be navigable between different modules. Double clicking on a module will open it, and there are up and home buttons for navigating to parent modules just as there are when editing models.
It is now possible to create ghost of modules using the ![]() tool in the Model Build Toolbar. This allows you to decrease clutter in the diagram. Module ghosts can only be placed in the same model the module resides in (no cross-level module ghosts are allowed). You change connecters starting from the module to starting from a ghost of it by drawing the connector from the ghost. Similarly, it is now possible to move connectors starting from a variable and going into a module to start from a ghost of that variable by redrawing them. None of these changes have any impact on model structure and the dialog that used to appear asking if you want to continue is no longer shown.
tool in the Model Build Toolbar. This allows you to decrease clutter in the diagram. Module ghosts can only be placed in the same model the module resides in (no cross-level module ghosts are allowed). You change connecters starting from the module to starting from a ghost of it by drawing the connector from the ghost. Similarly, it is now possible to move connectors starting from a variable and going into a module to start from a ghost of that variable by redrawing them. None of these changes have any impact on model structure and the dialog that used to appear asking if you want to continue is no longer shown.
The Find window now allows you to filter for constants, non-constants, unused variables, and module outputs used to create cross level ghosts. There is also an option to select based on Tags as noted above. Also, typing in a module qualified name will show all variables in that module in addition to cross-level ghosts.
On demand imports defined in the Import Data dialog box can now be set to control values, rather than replacing equations. The controlled values are treated as user controlled, and will be marked this way in the Parameter Control Panel .
Graphs and tables moved from one module in a model to another will retain their content regardless of the relative location of the variables being displayed. This allows copy and pasting of graphs and tables without having to ensure that cross-level ghosts are created to support the pasted content.
When you save runs or lock runs in the Data Manager it no longer causes the run names to have increasingly large numbers. Instead, runs are named based on the number of active runs showing, with a check to be sure that the name is unique. If there are runs with numbers in the list the next run will have a number one larger. If the active runs do not have numbers, the next run will have the default number 1.
It is now possible to open csv or txt files that are set up with import data as models. This is a convenient way to generate the variables necessary to support imports, and also to just look at data. These files are open from the File Menu just as models are, but will create a new model with the variables in the file and set up the import link so that you can look at values in Stella by running the model. You can also copy and paste the imported elements to other models if you only need to import a subset of the data.
When Stella prevents a negative value in a uniflow, constrains outflows to keep a stock non-negative, or constrains inflows because of a capacity constraint in a conveyor it will highlight the associated variables in yellow. In addition to this highlighting, there will now be a dropdown in the Run Toolbar that will navigate to the constrained variables. There is an option in the Preferences Dialog to turn this off. It must also be turned off in the Model Settings Properties Panel for the model you are working with.
Modules that are saved in separate files are now only written out if they have been changed. This is intended to make working on projects with a number of different contributors easier, as there will not be any changes made to module files that are not themselves changed. See Saving Changes to Modules for a discussion of saving models to separate files.
It is no longer necessary to use quotes for array elements that have special characters in them when editing in the Array Editor dialog box. The quotes will be added automatically when they are needed (for example in equations).
It is now possible to separately set alignment on the row and column table headers separately from the table cell alignment. See Table Styles Tab for details.
An option to use the native tooltip has been added to the Button (Interface).
There is now an option to hide the units of measure in the Gauge (Interface).
The causes and uses entries on the Context Menu has been enhanced to show more clearly the module relationships for variables used in modules different from where they are defined.
Display labels for array elements permit the use of more descriptive text for array labels while allowing the labels used in equations to be shorter. Display labels will appear in graphs, tables, and input devices including the Selector when configured for array selection. They can include any characters and do not need to be quoted. Display labels are defined in the Array Editor dialog box, and can also be imported as discussed in Setting Up Import Links.
When you are working with Tables and add an array using *, the table title will change to the name of the variable and the entries to the names of the array elements. This is the same way that graph labeling works. This is only used when the table has single arrayed variable and a * has been selected.
A number of new builtins have been added. LOGISTICBOUND allows the parametrization of a transition from one value to another following a logistic (s-shaped) pattern. EXPBOUND allows the parametrization of exponential adjustment from one value to another both convergent and divergent. The two together provide the same set of choices available as the preset shapes in the Graphical Function Tab. MINSOFT and MAXSOFT allow a smooth approach to a minimum or maximum value rather than the abrupt change that results from using MIN or MAX. these functions are described in more detail in Mathematical builtins .
In addition a SYSTEMCHANGE builtin has been added. This builtin returns the system change metric reported in the Loops Panel. Like PATHSCORE, it is computed after a run completes, so should not be used as an input to any other variable. For more detail see Specialized builtins.
The Find window now has an option to search in units. This is a convenient way to select everything that has the same units to either change the units, or change the appearance of the variables. The search functionality also allow search for empty values, which is most useful for finding variables without documentation, an equation or units - though the latter two are also shown in the toolbar.
The software responsiveness when making changes in very large models has been improved. In addition, macro definitions that contain only converters are now expanded inline to decrease memory consumption and improve performance during simulations (for more on macros see Working with Macros).
There is now an option on the Interface Settings Properties Panel to show gridlines on the interface pages. You can specify the number of gridlines horizontally and vertically and they will appear in light gray in the background. These can be useful for aligning objects.
When a variable has time varying data imported, it will also use the time varying values even if it is contained in a module or sector that is not being simulated. This makes it easier to perform partial model tests. See Partial Simulation Setup for information on simulating only parts of models.
We are now making available specialized builds of Stella Professional and Stella Architect for older Macintosh operating systems and x64 Linux systems. These are built from the same source as the standard releases, but may have limitations on some functionality. See Special Builds for more details.
It is now possible to map specific numbers to words for both output and input. For example 0/1 can become Off/On. This is very helpful for presenting information, especially assumptions, in a readable way. These values will appear in graphs, tables, numeric displays and elsewhere. Working the other way, it is possible to enter words and have them be mapped to numbers in numeric inputs and other text based input devices, as well as the new drop-down input. For more information look at Manage Number-Text Mappings dialog box and Edit Number-Text Mapping dialog box opened through the Model Settings Properties Panel. Number-text mappings are added to variables in the in the Scales and Ranges Tab or the properties panel or from the Format Numbers dialog box or the Format Variable dialog box opened from the Context Menu on graphs, tables and other objects. It is also available on the Set Time Label Format dialog box allowing arbitrary text to be displayed for selected points in time. You can also set up default number-text mappings from the Default Settings Formats dialog and they will be available on new models that you create.
You can now use the Find and Replace Dialog to replace text in equations in addition to modifying variable names and units. This can be very useful in adjusting array usage. The dialog content is also persistent, so when you close and reopen the model in an editing session the same selections will remain.
The new Dropdown Input (Interface) allows you to specify a set of values that can then appear in a dropdown for selection by the user. This can be used most effectively when a Number-Text mapping has been specified for the variable being used.
Changing the dimensions of a variable will now update the places that variable is used more completely, including adding in or removing the dimension even when the variable was originally used without square brackets []. This makes it more likely the equations will remain valid, and less likely that an oversight (such as a SUM function with no []) will generate unexpected behavior.
There is now an option on the Preferences Dialog to keep Excel files open when they are referred to during import or export operations. This is most useful for Excel files that may show a dialog (for example do you want to update data) when they are opened.
The Documentation Tab icon will now change from ![]() to
to ![]() when there is content in the documentation. This makes it easier to know which variables have documentation written for them.
when there is content in the documentation. This makes it easier to know which variables have documentation written for them.
There are two new Builtins. The first is MATRIXINVERT which will give the inverse of a square 2 dimensional matrix or slice. This is a special array function as described in Array Operation builtins . The second, SOFTWAREVERSION is a convenience builtin to allow you to detect which version of the software is currently being used as described in Specialized builtins.
The Create Import Template dialog box now has an option to create a template only for selected variables, and also to create a time varying import template.
The Find window will now remember your last search settings and there is also an option to find imported values and search in units.
New menu items have been added to the Model Menu to Import All and Export All. These are hand shortcuts with keyboard equivalent to import of export data without opening the respective dialogs.
You can now select different rows or columns in a table to copy to the clipboard. See Importing and Exporting Data with Copy and Paste for more discussion.
When using arrays to initialize conveyors it is now possible to specify a range within the array so that the array size does not need to line up with the transit time. See Initializing Discrete Stocks for details.
More of the cases where an equation uses a relative array position will now trace through each element allowing more complete control on these computations. Importantly, arrays that have a computed index values, and those using @ notation can now be combined with a relative index position.
There is now an option on graphs to disable scrubbing that can be set from Graph Settings Properties Panel. This is useful for small graphs that would not be readable when scrubbing values.
Using ghosts, it is now possible to set up an assembly so that the ghosts it uses are automatically connected to variables with the same name in the model. See Context Menu for more details.
When importing values on the interface using the Import Data action described in Actions (Interface) if the file starts with a row or column for "Time" (or the units of measure for time) the import will be treated as time varying. See Setting Up Import Links for more discussion of the different import types.
It is now possible to add documentation to connecters and loop labels. The documentation is entered using the Documentation Tab as it is for variables and will display on hover. When using the Model View object on the interface the documentation will display if the option to show documentation is chosen, though Loop Labels will always display their documentation.
Comparative tables can now be grouped either by variable or by run making it easier to see all variables for a given run. See Table Properties for more details.
The Pie Chart and the Allocation Input (Interface) have a new option to keep or remove the borders between the displayed pie slices. This can help to decrease clutter.
You can now customize the appearance of the tabs used to switch between different graphs and tables (or variables for the Group Input). See Pages Styles (Interface) for more detail.
A strict units checking option has been added. It is on by default unless changed in the Default Settings Run Specs dialog. This option will check for dimensioned variables being used in graphicals and builtins such as EXP. The option is set on the Model Settings Properties Panel.
Stocks with constant equations can now have the initial value updated from the Results Panel when using Stella Live™. This makes it easier to experiment with initial conditions.
In addition to the built in Assemblies that are part of Stella it is now possible to upload Assemblies to the isee exchange and use uploaded Assemblies by setting up a connection in the Preferences Dialog. See Assemblies Exchange for more discussion.
Sensitivity runs can now set up criteria to terminate and dismiss runs based on payoff values. This allows, for example, the exploration of future behavior for all runs that match historic behavior sufficiently well. Runs that do not match are not included in the final set of reported runs. The criteria are set in the Sensitivity Termination Criteria dialog which is accessed from the Sensitivity Specs Panel.
When setting up sensitivity runs, it is also much easier to add multiple sensitivity parameters at once By using the new multiselection functionality of the Find window as described below, you can add a number of different parameters together. When adding more than one parameter the Multiple Range Specification dialog will open allowing you to specify the minimum and maximum values as a proportion of the base parameter value.
There is also new sensitivity method that samples the sensitivity parameters sequentially. This is useful for going through a large number of parameters quickly to see which have significant impact in isolation. This is set in the Sensitivity Specs Panel.
When adding variables to sensitivity or optimization specs you can now select multiple variables to add at once. This is done in the Find window which has an OK and Cancel buttons when multi selection is supported.
If you select arrayed variables you will get be able to select which array elements to use.
If you paste a module and it is not possible to make all of the cross level connections between variables with the existing connectors new ones will be added to be able to make the connections. Cutting and pasting a module in a model will thus rewire all of the cross level connections as required. Invalid connectors from a module to a cross level ghost may also be removed to accommodate this.
Related to this, the error message for connectors into modules that do not have a cross level connection have been improved. The connector causing the error will now be highlighted when selecting the error message from the Run Toolbar.
In addition to controlling variables you can now control a slice of a variable. This is useful when you want to set a default value for all elements, then override specific elements with other values. To do this use a * appropriate position in the Choose Subscript dialog box. Array slices can be used in any of the controls on the interface (except the Allocation Input) and also on the Parameter Control Panel for the model. Specific element controls will take precedence.
The Parameter Control Panel now has an option to filter out imported variables. This makes it easier to see which model variables have been controlled using Stella Live, the interface, optimization or directly from the panel itself
When working with graphicals that are not apply-to-all there is now an option to open the Arrayed Graphical editing dialog. This allows you to select multiple elements of the array and edit the graphicals for them together.
The Preferences Dialog now has an option to hide thumbnails on the Interface Settings Properties Panel. Instead of a thumbnail just the page names will be displayed. This can simplify working with interfaces containing a large number of pages.
When you paste a variable into a model you can simply start typing to change the name - there is no longer any need to select the name first.
As you move the pointer inside of the Graphical Function Tab the point that will be moved by a click is highlighted making easier to see what will happen.
If you switch out of Stella Live by using the Stop Stella Live command on the interface or switching to edit mode on the model and make a run, the next Stella Live run will reuse the run number for that run. This prevents duplicate runs with the same result appearing.
When you add elements to a non apply-to-all graphical array the missing elements will be highlighted rather than contain a default graphical.
When you hover over a variable on the legend of the Results Panel the associated graph line will be highlighted.
You can now drag to reorder array elements in the Array Tab rather than having to delete and add them.
There is now an option to store model runs in a binary format. This is intended for very large models and can be set model by model in the Data Manager.
There is a new command line option -cds to write to export data using , as the decimal delimiter. See Stella Simulator Arguments for more details.
It is now possible to run optimizations on the interface. To do this the optimization is first set up on the model as described in Optimization and Calibration and then executed on the interface using Run Optimization as described in Actions (Interface).
The Display Time (Interface) object now has an option to show the progress on sensitivity and optimization runs. This is a convenient way to let users know that work is being done in the background.
When using a Selector for either a placeholder or array dimension you can now change the value of the selector while an optimization is running. You can also double click on a minimized graph or table without stopping the optimization.
When there are divide by 0 or other overflows during an optimization there is now an option to stop the optimization with the value generating the error preserved to understand why it happened. This can be set on the Optimization Specs panel when running Powell optimizations as described in Optimization Methods.
Zoom is now based on selected content, making it easier to select and then zoom in on a particular area in a model.
You can now set the thickness and polarity font for all connectors in a model in addition to changing specific connectors. For details see the Model Style Properties Panel
When using the Format Numbers dialog box an Apply button has been added that allows you to make changes to multiple number formats without having to reopen the dialog.
You can now use placeholders and wildcards in the Group Input (Interface) just as you can with other input and output objects.
In the Array Editor dialog box dimension names that conflict with a model variable or builtin function (dimension names need to be globally unique ) will now put up a dialog letting you know there is a conflict.
Model with long runs and noisy data should render more quickly with Stella Live and in Suggest View improving usability.
Graphs now have an option to rescale if the specified bounds are exceeded. This is useful for setting bounds that are usually right, but still having the graphs display all information when they are exceeded. See Graph Series Property Panel. The selection of scales when only one of a minimum or maximum is set have also been adjusted to work better for most cases.
Sliced graphs allow you to overlay value from different time periods (most commonly years) for a single variable to see how one period compares with another. See Graph Settings Properties Panel for details.
To make it easier to move definitions between models, and to duplicate specs and make modifications Import, Export and Duplicate button have been added in the Sensitivity Specs Panel, the Payoff Specs panel and the Optimization Specs panel.
The Payoff Specs panel has been updated to make setting up a calibration payoff much simpler.
Scientific notation has been added as an option when formatting numbers and is set in the Scales and Ranges Tab of the properties panel.
Graphical inputs ![]() on the interface can now have axis labels specified in the Graphical input (Interface) panel.
on the interface can now have axis labels specified in the Graphical input (Interface) panel.
You can now add a file for export without having to first create it. See Export Data dialog box for details.
The PERCENTILE builtin can now take an optional fourth argument which makes it possible to find the percentile value of an attribute based on volume (for example median age based on population). For more details see Array Operation builtins .
A new option has been added to the Context Menu on the model that allows you to select all variables arrayed the same way as the selected variable, making it easier to manipulate arrays.
Assemblies provide a new way to get started building models and easily add commonly used structures into ongoing modeling work. They work with suggested completions that fill in equations when possible or make suggestions based on the structure as you have drawn it. There is more information in Assemblies.
Note Use the ![]() button on the Mode Toolbar to open the Assemblies Panel and begin working with Assemblies.
button on the Mode Toolbar to open the Assemblies Panel and begin working with Assemblies.
Suggested completions smooth the addition of simple equations based on the connections you make on the model diagram. They are turned on and off from the Mode Toolbar and are very helpful when working with Assemblies. Details on the way suggested completions work are in Completion Support.
The Results Panel has been extended to work with multiple variables and also has the ability to show all elements on an arrayed variable. This makes it very easy to see two or more variables next to one another to aid understanding and debugging model behavior.
When there are two variables that have the same meaning it is now straightforward to replace one with the other without needing to edit equations, graphs, or tables by dragging one on top of the other. This is very helpful when combining assemblies. See Deleting and Replacing Model Items and Data.
An option has been added to export values from multiple runs on the interface making it easier to provide comparative summaries of different experiments conducted by published simulation users. See the action descriptions for more details.
There is now a function to flip the selected elements of a diagram either horizontally or vertically. This is accessed through the Context Menu.
The suggest units functionality - from either the Equation Tab of the properties panel or the Units Entry popup will now look at both the equation for a variable, and equations using a variable, to try to determine the best units to suggest. When it is possible, units are also set automatically while working in Suggest view.
The categories builtins are put into have been reorganized - in both the software and the help. See Builtins for the organization and Equation Tab for selecting them in the software.
The Save As menu on the File Menu will now allow you to save the current module picture as a vector (pdf, svg) or raster (png, jpg, gif, bmp) image file.
The AGECOUNT builtin provides a convenient way to look inside conveyors and queues (as well as non-negative stocks when using cycle time integration) returning the quantity of material falling within an age rate. See Discrete builtins for details.
For conveyors with inflows that at spread evenly or based on a distribution there is now an option on linear leakage to leak the specified fraction of material regardless of the time the material spends in the conveyor. See Equation Tab
You can now specify a variable to be displayed for a module allowing glimpses into behavior of the modules. The selected indicator variable can be a placeholder and will be displayed on the diagram just as results are displayed for other variables and in the Results Panel. See Module Properties Tab for details on setting these.
The new builtin SHORTESTPATH will compute the traversal sequence that will minimize the cost of getting from 1 node to another for a given adjacency matrix - where cost can be in distance, time or dollars. There is a corresponding builtin TRAVERSALCOST that computes that cost of such a path (or any path) through the adjacency matrix. See Array Operation builtins for more details.
The Find and Replace Dialog now has an option to change only the beginning or ending of variable names.
If you open a Vensim model with polarities on the connectors those will now be brought across to Stella.
Increasing the size of the graph in the Loops Panel now allows smooth adjustments.
A new measure of activity during a simulation is now available to make it easier to understand which loops are driving behavior during periods of significant change. The System Change and Contributions are on the Loops Panel and there is more discussion of the concepts in the Loops That MatterTM Overview.
When you select an arrayed variable for use in a table, graph, or other output object you can ask to display the sum, min, max or mean across a slice of the array in addition to specific array elements. See Choose Subscript dialog box for the details of doing this.
It is also possible to set up array definitions so that the sum, min, max, and mean can be selected when using a Selector or looking at values in the Results Panel. These are specified in the Dimension Configuration dialog box.
There is now find and replace functionality that allows you to change the names of all variables in a selection, or for the entire model. Use Shift+Ctrl+F or Ctrl+H (Windows)/Shift+⌘+F (Macintosh) to open the Find and Replace Dialog.
To be consistent with most other applications the Find (and Find and Replace) functionality is on the Edit Menu, and not on the Model Menu as it used to be.
You can now optionally specify a start and stop time for tables. This makes it possible to show value for a subset of a runs range. See Table Properties for details.
When using Undo (Ctrl+Z/⌘+Z) or Redo (Ctrl+Y/⌘+Y) the thing that was changed will not be highlighted (navigating to the appropriate module or page if necessary) and the associated panel open when one thing was changed. In some cases, because of cascaded dependent changes or changes applied to multiple selections, it may not be possible highlight anything.
The autocomplete function now works even when there is no space after the cursor. In addition, selecting [ when inside an existing [] pair will replace the content inside the [] with whatever is provided by the Choose Subscript dialog box.
More properties can be set on the panel when multiple objects are selected. For example when working on the interface you can select multiple sliders and set the ranges on all of them at the same time. See Objects and Properties for more discussion.
Flow valves can now be resized just as other building blocks can. The Model Style Properties Panel now allows the default size of flow valves to be set separately (they used to be the same as converters) as does the Default Settings Diagram dialog.
It is easier to position content in Model View objects (including Storytelling pages) using arrow keys.
There is a new builtin NORMALPINK (see Random builtins ) that can be used to generate correlated noise and simplifies opening of Vensim models.
A number of new builtins have been added, and others extended to provide more behavior.
The new RUN builtins RUNCUM, RUNMAX, RUNMEAN, and RUNMIN make it easy to pull values of a variables from the current run, or from other runs much like the HISTORY builtin. It is also possible, when using time varying imports (Import Data dialog box) to pull future values for the current run. See Data builtins for more detail.
The new LOOKUP builtings LOOKUPMIN and LOOKUPMAX make it easy to find the maximum or minimum in a graphical. The existing builtins LOOKUPAREA and LOOKUPMEAN have also been extended to take a variable number of arguments to simplify equation writing. See Specialized builtins for more detail.
The STEP builtin now takes optional arguments for duration and interval maxing it easy to create a temporary step, or a repeating step. See Test input builtins for details.
When restricting outflows from queues to content with certain attributes you can now use a dimension name in addition to numbers to specify which attributes to filter on. This is a convenient way of dispatching from an non-arrayed queue to arrayed stocks. See Queue Computation for more discussion.
It is now possible to specify arrays for parameters when setting up sensitivity. This makes it easier to specify a number of parameters, and to change array sizes without having to modify the sensitivity settings. For details see Sensitivity Specs Panel for mode detail.
The translation of Vensim models with multiple views now breaks the model up into modules and those the interconnection between the modules on the top level model. This makes it easier to work with larger models. See Opening Other Models for details.
When importing data as a run from the Data Manager using the Load External Data dialog box there is now an option to match unqualified names to variables within modules. This is useful when the data files list variable without module qualifications as might happen with values exported from a Vensim model.
The ^ panel button has been replaced with [ to make it easier to work with arrays. See Equation Tab for details.
Then exporting results from the interface the user will now be prompted for the name to export to. See Actions (Interface) for details.
Outflows from non-arrayed stocks can now have arrays set.
Now when you make graphical changes in the Graphical Editor dialog box Stella Live will update the module results as you make changes to the graphical. If you uncheck the option for "Stella Live update on drag" in the Model Settings Properties Panel changes will not be applied until you click on the OK button.
The minimum and maximum set in the Scales and Ranges Tab are now used automatically when adding a variable in the Sensitivity Specs Panel or Optimization Specs.
The lock icon that appeared in the upper right corner of objects locked on the interface has been replaced by a tooltip that indicates the object is locked. Double click or right-click and select unlock from the menu to edit a locked object.
We have dramatically simplified the process for building high quality interfaces by providing a number of Designs that you can bring into your interface and then customize. See the overview in Building Interfaces as well as the discussion in Designs. You can even create your own Designs from the Interface Menu (Interface) or by saving an Interface to the Custom Design directory specified in the Preferences Dialog.
Check out the quick tutorial on our tutorials page.
You can directly edit content on Templates by double clicking on it from an Interface page. Right clicking will also take you to the Template page. Locked content will now display a ![]() icon in the upper right corner (right-click to unlock).
icon in the upper right corner (right-click to unlock).
A number of new shapes have been added for display on the interface, including arrow, star, ellipse, cloud, and speech bubbles. You can also put a corner radius on rectangles. See Shape (interface) for more detail.
To improve consistency in publication there is now an option (on by default) to use font faces that are available on almost all computers. Selecting fonts from the smaller list will make interface users see the same thing you do. The option is set in the Preferences Dialog.
Changing the Interface page size will now scale all content to the new size. See Interface Settings Properties Panel for more details.
You can now add a description to each interface page. The descriptions display when you hover over the page in the Pages Panel (Interface). You set the description in the Interface Settings Properties Panel.
You can now put Selector controls directly onto the model diagram. This makes it convenient to go through placeholders or array elements in graphs and tables.
You can now use SVG files in the Graphics box, Button (Interface), and other places that take images.
There is a new option for discrete optimization that allows you to find optimal values that are integers or otherwise quantized. See Optimization Methods for more detail.
The Navigation Control (Interface) now provides more options on appearance and layout including spacing between tabs and padding of text within them. The naming conventions used in the panel have also be simplified.
You can now set the label position and control the border and appearance more precisely for Numeric Displays as detailed in Numeric Display Properties. In addition, numeric displays on the model and interface now look the same.
You can now add tooltips to Button (Interface) that will display with the user positions the cursor over the button. In addition. Annotation Button (Interface) can be configured to display when the mouse moves over its button rather than requiring the user to click on the button.
You can now set the run name in the interface using the Button (Interface).
It is also possible to set the beginning of the run name in the Model Settings Properties Panel. Using this instead of Run1, Run2, and so on you can have Test1, Test2, or another prefix displayed on tables and graphs.
In additions, for sensitivity runs that are specified using an external file you can include the run name in addition to parameter values. This makes it easy to name the runs according to their inputs (Low, Medium, High and so on). For details see the Sensitivity panel.
Tables now allow the use of a * to represent all elements of an array that will update when the array definition changes. See Table Properties for discussion.
There is now a transparency setting on Graphics Frames (interface only). This makes it easier to achieve different visual effects. See Graphics Properties
The options to run by module now allow you to turn on and off nested modules when you change the running state of a module on both the model and interface. This is done in the Partial Simulation Setup panel.
The software will also keep track of changes made to which modules are running on the interface and continue to run only those modules on the model until inputs are restored or the modules are switched on or off directly.
You can now search for exact matches in the Find window by using "" around a string, as well as names that start or end with something. Starting and ending spaces are also recognized to simplify looking inside of names.
It is now straightforward to mark variables as both inputs and outputs for making cross level ghosts. This is useful when working with modules that are saved separately and can be modified in that way. The is set from the Context Menu for a variable. There is also a new option added to the Model Settings Properties Panel that will suppress module connection errors.
Equations that are either missing inputs, or have extra inputs, can now be fixed by clicking on the error message in the Equation Tab. The related connectors will be added to, or removed from, the diagram.
Simulation speed has been increased for larger models and the long wait time that sometimes occurred as a simulation was beginning reduced. LTM has also been improved for large models requiring algorithmic search to detect loops.
A Restore button has been added to the Data Manager dialog and loading parameters from a run now opens the Load Parameters dialog giving you more control over which equations are overwritten with values from the run.
The Export Parameter Values selection from Actions (Interface) for Button (Interface) now allows you to specify which parameters in addition to those that have been changed to export. This allows the creation of more complete import data sets. There is also an option to export only a single value.
There is also a new action to export the variables in a Table making it easier to keep exports up to date with your needs.
An option has been added to prevent multiplayer games to continue when a player drops. This is set in the Multiplayer Options dialog, which has also been improved for usability.
There is now an option on the Publishing Options dialog to prevent the current page from displaying in the URL for a published Sim App. This prevents users from skipping pages and also makes your interface appear as a single page to the browser so that the browse's back button will leave the interface altogether rather than navigating within it.
The Navigation Control (Interface) now has the option to display vertically (tabs stacked one on top of another) or in folio orientation (text running up from the bottom). This provides more flexibility around the appearance of navigation choices on the interface.
It is now possible to change graphical functions in a model just as you can change constants in Stella Live. Simply open the Results Panel and click on the button on the bottom to open the Graphical Editor dialog box. The model will be simulated with the changes you have made (but no change will be made to the model equations).
The option to turn off Stella Live updates when moving knobs has also been added to the Model Settings Properties Panel. Turning this off is helpful for larger models that take significant time to simulate.
When there are imported variables in a model the tooltip for the variable will name the active import source file (and sheet if appropriate). This makes it easier to determine where data is coming from.
Messages displayed when testing imports in the Import Data dialog box have also been improved to make it easier to find the source of errors.
There is now an option in the Numeric Display Properties to update on user input when stopped. This allows values to be updated after a run has finished and will display the currently computed value (effectively the beginning value for the next run) rather than the last value for the run just completed.
In addition to resetting after 1 time unit, you can now have a control (such as a slider) reset after any amount of time. This is specified in the options for the individuals controls such as the Slider (Interface).
Note If you work with a model using this feature in an earlier Stella version you will lose these settings.
There is now an option whether to create an animation when switching between pages on a published interface. For interfaces with consistent backgrounds on different pages the transition animation can be distracting and have been turned off by default. It can be changed on the Interface Settings Properties Panel
There is a new builtin that shows the total number of runs that will occur during sensitivity. The builtin is SENSIRUNTOTAL and is detailed in Specialized builtins. This can be very useful for displaying progress on the interface.
It is now possible to set the arrays on inflows into non-arrayed stocks. This can be convenient when setting attributes for different array elements flowing into conveyors and queues. Outflows continue to inherit the array settings of the upstream stock unless they are connected to a downstream stock arrayed differently.
When using the expand button on interface graphs (see Graph Settings Properties Panel) smaller fonts will be enlarged to make the graphs easier to read.
You can now apply the document tab with multiple variables selected. If they share the same documentation or units (or if they are all empty) you can specify either for all of the selected variables by editing once. See Documentation Tab for details.
From the Data Manager when you click on the button to load external data as a run, you can now directly use an isdb file from a different model, or a previous version of the model you are working with. This makes it easier to compare results across models without an extra export step.
It is now possible to aggregate similar loops, and purge canceling loops. This makes it easier to find and visualize multiple loops that have similar effects and to make more compact explanations of behavior for complex models. See Loops That MatterTM Overview for more discussion and Loops Panel for details on setting options.
Bar graphs can now be displayed over time. See Bar Graph for more discussion.
The Dots only option on line graphs is now applied by series, making it possible to mix and match dots and connected lines. See Graph Series Property Panel for details.
Graph axis ticks can now be applied to increase readability. See Graph Settings Properties Panel
We have also streamlined the settings for histograms to make them more intuitive. See Graph Series Property Panel for details.
For import templates created from the Create Import Template dialog box the default format for one dimensional arrays now includes the array name, and there are options to get element by element listings of arrays. It is also possible to add units of measure as a means of documentation.
Stella now runs natively on the new Apple Silicon Macintosh computers. These new computers are fast, and running without Rosetta makes them faster still. Though we have not completed all testing (thus the PreRelease flag) so far we have not found any differences to the existing Mac products and you will see a big boost in performance if you have one of the new Macs.
In addition to being able to highlight loops on the stock and flow diagram, it is now possible to create a simplified CLD for a loop, or loops, of interest. This is an excellent way to highlight structure generating behavior and provide compact and uncluttered views of it. See CLD Generation for more discussion.
It is now possible to record chat logs in multipliayer games with data collection enabled. See Publishing Options dialog
and Chat Log for more detail.
It is now possible to mark specific queues and non-negative stocks as not-passthru rather than having the software do this automatically. See Equation Tab for more details. The algorithm for determining which stocks will constrain outflows without considering inflows has also been improved to work more consistently with macros and arrayed variables.
When creating discrete graphicals there is now an option to treat them as accumulations so that they will render as a continuous output with the same total area under the curve. This is useful, for example, in breaking up annual demand into value changing slowly from month to month. See Graphical Function Tab for details.
The results of the LTM computation can now be saved from Stella Simulator, allowing continued analysis of models. See
See Stella Simulator Arguments for more discussion.
There is now an option in bar graphs to stack them. This allows you to create comparative graphs of more than one variable and display them at selected times. See Bar Graph for more discussion.
Stacked graphs have options to display either summed or individual values and also to show values only in the legend on scrub. See Area Graph for discussion.
A Span Slider has been added that allows a range to be set for two variable that represent a lower and upper (or min and max) value of the same concept. This is very useful for controlling sensitivity ranges. For more details see Span Slider(Interface)
You can now array placeholders. This allows them to be used in graphs with a * and wildcards so that a single graph can be used to show large number of different combinations of values. See Placeholders for more discussion.
In additions to using a subrange for a variable arrayed by the parent range, it is now possible to use the parent range in a variable arrayed by the subrange. This makes it much easier to move back and forth between partial and full range equations. See Subranges for more discussion.
The PERCENTILE builtin allows you to look at the distribution of values within an array slice - making a generalization of the MIN and MAX builtins when used on arrays and also allowing the computation of a median and any other percentile. See Array builtins for details. The LOOKUPRANDOM builtin allows you to specify an arbitrary PDF and then pull values from that. See Random builtins for details.
Changing the array dimensions for a variable will now change many of the equations it is used in to reflect the updated dimensions. This should decrease tedious hand work. Importing arrays is also not more flexible allowing blank cells to be used in the import definitions making it easier to set up subranges. See Setting Up Import Links for more discussion.
A convenience feature has been added to the Arrayed Equation editing dialog that makes it easier to set up import sheets one variable at a time.
A feature has been added to duplicate the current graph in a pad. This simplifies creating a number of quite similar graphs. See Graph Series Property Panel
The Create Import Template dialog box now has an option for add units to the variables listed. This can be helpful when using constant lists as part of a documentation process.
The HISTORY builtin can now be used to get values from different runs. This makes it easy to make use of values in a base run, and also to perform operations across runs. See Data builtins for more discussion.
The ISNAN builtin checks to see if a variable has the value NAN. This is useful with the HISTORY builtin and also when working with data. See Specialized builtins for details.
There is now a convenient way to duplicate an array dimension using the Array Editor dialog box. This can be helpful when working with Subranges. Subranges will also now be displayed when selecting variables into equations.
Spell checking has also been added to the Array Editor.
Feedback loops that go through flows, but not their connected stocks, are now visually distinct from those that go through both the flow and the stock.
It is now possible to adjust the symbol and name size on causal loop diagrams generated using LTM making them much easier to read. See Loops Panel for more discussion.
Sensitivity simulations are now supported on the interface. To start a sensitivity select Run Sensitivity for the button action as described in Actions (Interface). The sensitivity run will execute and graphs and tables will update as runs are completed.
You can now place percentile charts (across runs) and histograms (across runs or time) on the interface. These work the same way that they do on the model and will repopulate as sensitivity runs occur. See Bar Graph for more details on histograms and Graph Series Property Panel for more details on confidence graphs.
In addition to specifying bounds for sensitivities as numbers, you can also specify model variables to use for the bounds. This is most helpful when performing sensitivity on the interface as it allows the interface to specify the range over which to perform the sensitivity. This range can be directly under user control, or specified in the background based on other user selections. See Sensitivity Specs Panel for more detail.
We have improved the link score computations for the effects of flows on stocks by using the change in flows relative to the change in net flows rather than the flows directly. The new computation gives results that are largely independent of the exact flow formulations used and generally improve continuity of the loop dominance measures. See Loops That MatterTM Overview for more discussion.
In addition to specifying numbers for the time at which a model starts and stop you can also specify model variables. This is done in the Model Settings Properties Panel by selecting a model variable for the associated time. You can use any model variable, computed or controlled. If there is an issue determining the proper start time and error message will be displayed.
You can now select multiple variables in the find, including selecting variables in different modules. This makes it possible to change the array settings on multiple variables at once and also to add multiple variables to tables, graphs, and summing converters. Multiple selection is done using Shift or Ctrl + Click as described in Find window.
You can now drop variables directly into summing converters and placeholders, either by selecting them on the model or in the Find window. See Equation Tab as List for more discussion.
The Array Tab of the properties panel is now available when there are multiple variables selected - whether on the diagram or in the Find window. This makes it possible to set, or add to, the dimensions for multiple variables.
Ovens now have a cleaning time that keeps them idle after the completion of processing. This makes it easier to represent turnover where there is a required set up or recovery time before the next item can be processed. See Oven Computation for more detail.
Graph legends can be selectively excluded to reduce clutter and make more area available for drawing the graph. See Graph Series Property Panel for more discussion.
The opening of Vensim models is smoother with unrecognized functions brought directly across and better array support. See Opening Other Models for more detail.
It is now possible to load in data as a run in Stella Simulator. This is most useful for calibration runs as described in Stella Simulator Use Examples.
When using the builtin SIZE to provide the number of elements in an array dimension you can now simply specify the dimension name. See Array builtins for details.
The translation utility has been updated to handle more Vensim models, especially those that use flows as inflows to (or outflows from) than one stock equation. See Opening Other Models for more discussion.
It is now possible to use equations to specify the internal content of conveyors and queues, as well as to specify the initial values of attributes and cycle time within stocks. These additions allow a model to be initialized in a way that is representative of the true initial state of the system (for example a conveyor with initial growth). For more information on this see Initializing Discrete Stocks.
To simplify setting optional equations rather than having to turn on and off specific optional equations, such as that to arrest a conveyor, the equations can now simply be left blank. See Equation Tab for more discussion.
The interface used to find variables has been streamlined to make it easier to perform the most common tasks. See Find window for more details.
The right click menu can now be used to show the causes and uses of a variable. In addition, the causes and uses now list both first and second order causes and uses, making it easier to visual dependencies. See Context Menu and Causes Uses for discussion.
You can set up multiplayer games to automatically advance based on a timer. This forces games to continue even when some players have not met the deadline of committing their decisions. See Multiplayer Options dialog for details.
Files saved will no longer change when there have been no changes to the underlying model. This used to happen because of the sequence in which content is written out and changes in internal object IDs.) The invariance includes modules saved as separate files which facilitates use with version control systems. See Saving Changes to Modules for information of saving modules as separate files.
The "Report as" option associated with a converter will now be used on the interface to determine whether the current value of the variable will display when a model is paused. Selecting stock will ensure that the current value is always displayed (even if it might change after resuming). See Scales and Ranges Tab for details on setting this.
An option has been added to allow diagrams to draw only the outline of shapes. This is useful when you are using a diagram to overlay other content. See the Model View documentation for details.
If you draw a connector that already exists you will have the option to replace the old connector with the new. This is helpful for moving connections to ghosts, and also rearranging connectors in busy models.
You can now use Ctrl+E to switch to edit Model and Shift+Ctrl+E to switch to explore or experiment mode. A full list of keyboard shortcuts is available at Keyboard Shortcuts and Key Combinations.
The new builtin ALLOCATE allows allocation of quantities taking into account both availability and attractiveness. This can be used to allocate a supply to different consumers, or to allocate demand to different producers. See Array builtins
for more discussion.
You can now specify a precision for graphical inputs on the interface allowing, for example, to keep to integer values. See Graphical input (Interface) for detail.
It is now easy to find every variable that uses a given dimension. This is useful for when dimensions are changed, and also for finding unused dimensions. See Find window for details.
Loops that cross modules will now highlight the modules involved in the loops and the associated module connectors (if they represent only a single cross level connection). This makes is somewhat easier to follow loops across modules, but the automated CLD view (see CLD Generation) may be a more effective way of visualizing such loops.
You can include html tags in text boxes and annotation on the interface. These will display and behave the way they would in a web page, and can provide a convenient way to add links (or embed content) in interfaces. See Text boxes and Annotation Button (Interface).
Understanding models has never been easier! Loops that Matter is new functionality in Stella 2 that allows you to immediately visualize the impact of every variable in a model on every other variable during the course of the simulation. The software identifies the feedback loops important to generating behavior and allows you to create causal loop diagrams that display those loops in a simplified form. For more see the Loops That MatterTM Overview.
Stella will now create stock and flow diagrams, or fill in missing pieces, for models created in other applications and brought in to Stella. See Opening Other Models for more details.
When a flow is forced to 0 because of a non-negative stock, both the flow and the stock will now highlight to show that this has happened. Hovering over the highlighted stock or flow will give a message showing what type of constraint was encountered. There is an option in the Preferences Dialog to turn off unless an option in the Model Settings Properties Panel is used to turn it off for a specific model.
New to Stella 2.0 is the ability to open Vensim .mdl files directly. Both the equations and diagram will be translated. See Opening Other Models for more details.
The Equation Viewer will now display equations in a table, making it much easier to read and navigate through the listing. The table can be saved to html or copied to the clipboard in for pasting into a spreadsheet.
The LOOKUPMEAN builtin can be used to compute the mean value of a graphical. This is most useful for graphicals on the range of 0 to 1 representing probability density functions. The builtin MLPANN can be used to embed artificial neural nets in models to capture arbitrary nonlinear relationships. The builtins PATHSCORE and LOOPSCORE are for use with Loops that Matter. See Specialized builtins for more details.
Material coming into a conveyor is normally put at the beginning, then sent across the conveyor over the course of the simulation. It is now possible to distribute the material over the conveyor following the contour in a graphical. This effectively allows arbitrary residence time distributions which provides more accurate modeling in cases where the time in stock is variable. See Spreading Conveyor Inputs for more detail on how this works.
We have added the ability to create an interface where Stella Live is always on. Simply set this option in the Interface Settings Properties Panel. There is also a new action to first run a model, and then enter Stella Live, mimicking the behavior of the run button during model development (see Actions (Interface)).
You can now save an optimization log to disk during the optimization. This allows recovery in case of a software failure which is valuable for optimizations that run for long periods of time. See Optimizer Messages for more detail.
During data collections the results from the last Stella Live run can now be captured (see Data Collection for more details).
It is now possible to create and use subranges to simplify both array operations and the selection of values from arrays with different dimensions. See Subranges for more details.
You can now set the size of CLD pages making it easier to organize your content. See CLD Style Properties Panel for details.
We have added an option to include precomputed converters and flows when exporting data. See Export Data dialog box for more details.
We have added a function that allows you to quickly compare two runs. This makes it easy to track down differences between runs, especially differences resulting from changes in constant or graphical values. The Runs Comparison window reports the differences between two runs and the first time those differences occur. It is opened from the Open Runs Comparison command on the Windows menu. See Runs Comparison for more details.
You can now control the speed at which a simulation progresses using a variable(rather than the old simulation speed control). Simply select the model variable you want to define the simulation duration with in the Model Settings Properties Panel. You can use a slider or other input device the then set the simulation duration or speed. You can also vary the simulation speed based on model conditions.
There is an additional export option that reads a list of variables from a file and then exports values for those variables. This is most useful for batch processing where the list of values to view is not known ahead of time and can be written to a file allowing a model to report different results without having to edit the model. See Export Data dialog box for details.
It is now possible to create definitions for units that already have built in definitions, effectively replacing them. This makes it easier to have units suited to your needs. See Unit Editor dialog box for details. This dialog has also been improved so that double clicking is not required to edit unit definitions. In additions, changes to unit definitions are now tracked in the undo/redo system. We have also added Tons and Tonnes to the built in definitions.
Causes, Uses, and Selection Hisotry
The selection history panel has been replaced with menu items in the Equation Tab of the Properties Panel and also on the Results Panel. These menu items allow you to look at the previous 10 variables you have worked with and, if you select a previous variables, the next ones that you worked with. See
You can now override the settings for your computer to choose whether a , or . should be used as the decimal delimiter. This is done from the Preferences Dialog.
When dragging things on the model dragging off the current boundary of the model will no longer aromatically add pages. Instead the page will be added only after you release the mouse button. Thus, moving off then back onto the current model extent will not cause a change in the number of pages used for the model diagram.
You can now set the border radius on text boxes (Text Box Properties Panel) and annotation popups (Annotation Button (Interface)).
There is now an option to add a grid line at 0 on graphs. See Graph Settings Properties Panel.
Queue outflows can assign a list of attribute values that they will dispatch. This allows downstream routing of material flows based on attributes without having to create separate flow channels for common processing resources. See Queue Computation and Equation Tab for more discussion.
You can now use expressions such as SELF[Dimension-1] inside of equations to reference prior (or later) elements in arrays. See SELF for an example. Similarly, you can create loops with apparent circularity that resolve on an element by element basis. See Referencing other Array Elements for more discussion.
We have generalized flow concept to allow you to specify that a converter should be reported the same way a stock is on tables. This is most useful on the interface, where stock values are reported at the current time when a model is paused, but converter values are not. It is also helpful on financial tables, where converter values are reported one DT in advance of the reported time for stocks (the end of period concept). See Scales and Ranges Tab and Financial Tables for details on setting these.
There is now a number formatting button on the panel used to set up tables and financial tables, making it easier to adjust these to your needs. See Table Properties and Financial Tables for usage.
The simulation log only opens when model opens if there are errors to report. Parameter overrides are still reported, but will not cause the log to open. There is also a new shortcut on the Run Toolbar to open the Message Log whenever it has content.
There is a new builtin IRR that computes the internal rate of return on a stream of payments. See Financial builtins
for details.
The Cycle-time builtins now take an optional attribute range which allows you to look at the characteristics of batches with specific attributes. See Cycle-time builtins for more detail.
The causal lens allows you to (and by default does) filter out causes from initialization as well as constants when looking at the causes. This removes variables that do not directly contribute to the dynamic behavior of another variable. See Causal Lens™ for details.
There is now a FIFO option on conveyors so that they maintain material in the order received and respond immediately to changes in transit time. See FIFO Conveyor Computation for more discussion. Conveyors are marked FIFO in the Conveyor parameters.
You can now set an attribute on flows that are connected to discrete stocks (and non-negative stocks in Cycle-Time Mode). The attributes can be measured on downstream stocks and flows and can optionally be used to prioritize material for processing in queues. See Attribute and Cycle Time Tracking for an overview, Flow options for a description of how to set the attribute, and Discrete builtins for the new builtins used to measure the attributes.
The discrete attribute can be used to prioritize material entering the queue (so the queue is not longer FIFO). This allows material from different sources to be processed differently. See Equation Tabfor the use of the attributes to prioritize material flowing into queues and Queue Computation for more discussion of how the material is ordered.
Queue dispatching to multiple places now allows you to set priorities for destinations and will provide a round robin mechanism to make use of all available destinations (typically ovens). See Equation Tabto set the parameters and Queue Computation for more discussion of how the priorities are used.
Material that has been in a queue for too long can now be purged from the queue through an outflow that is only active when the age of material has exceeded a threshold. See Flow options to set a flow so that it will purge a queue and Queue Computation for more discussion of the way purging works.
Conveyor inflows can now be marked to be spread across the existing material in a conveyor rather than added at the beginning of a conveyor. This is useful when parallel conveyors are tracking similar groups of things, such as aging people, and one conveyor leakage can be used to introduce material to another as it would with incidence of a disease. It is also useful in demographic modeling in general as it makes is much easier to deal with immigration and emigration. See Flow options to set the flow and Spreading Conveyor Inputs for more detail on how this works.
Graphical functions now have a number of suggested forms available that make it easier to draw smooth curves. See Graphical Function Tab for more discussion.
Two new builtins have been added to make it easier to work with graphical functions. LOOKUPINV will invert a graphical so that, if the graphical is monotonic, the value of the input required to get the specified output will be returned. LOOKUPAREA will return the area underneath the graphical up until the indicated input value. For more details see Specialized builtins
The ROOTN builtin returns the nth root of the first argument. See Mathematical builtins for details.
You can now define the elements of an array (both their names and the number of them) using Import Sheets. This allows you to change the specific content of array elements without having to edit the model, and can be very useful for data intensive model set up. See Import Data dialog box for details.
We have added a new graph form that allows you to represent two sets of equally sized array entries on the left and right hand side of mirrored horizontal bar graphs . A common use of this is a population pyramid which shows the number of people by age group separated by sex. See Pyramid Graph for more discussion.
The bar graph now has a variation in which the bars are drawn horizontally instead of vertically. With the exception of orientation, the options and behavior of the two types of bar graphs is identical. For more information see Bar Graph
A new financial reporting style table has been added on the interface to make it easier to present information in the style of financial reports. It allows formatting, including font and color, to be applied line by line. For more information see Financial Tables.
When you place graphs on the interface you now have an option to provide an expansion button for the graph. This will make the graph bigger, and also provide a control so that the interface user can zoom in to see a narrower time range on the graph. See Expanded Graph dialog (interface only)
Published interfaces can now support keyboard input and alternative text to improve accessibility. See Interface Accessibility for more discussion.
You can now add an entire array (or a slice of an array) to a graph and have it stay in the graph in that form. This simplifies graph definitions and improves labeling while also supporting changes to array element definitions without having to rebuild a graph. See Graph Series Property Panel for more discussion.
We have made a variety of usability improvements that should make it easier to build and use models including:
There is a new style of the slider (horizontal only) that can give your interface a more modern look. See Slider (Interface)
There is now a panel that will open and list all spelling errors that have been found in variable names. See Spell Check Panel for more details. Improvements have also been made to the ignore selection in spell check so that anything ignored will be remembered with the model.
The module navigation panel allows you to see all the modules in a model and their containment structure in one place. It is a very useful device for quickly navigating through large models. See Module Navigation Panel for more details.
You can now put labels on modules so that the module name used in graph, tables, and cross level references can be short, while the name displayed on the module can be more descriptive. See the Module Properties Tab for more discussion.
The file menu now has a function to export your model as a bundle. This creates a zip file including your model and all supporting files (images, movies, import sources and export destinations). For more details see File Menu.
If you specify a lead-in time for use in an interface then results will always be shown till the lead in time in presentation mode and when published (no blank graphs). See Interface Settings Properties Panel-to see how to set the lead-in time.
A new option to lock a model diagram can be used to prevent any movement of variables or other objects in the model. This is useful for preventing inadvertent changes or reminding others that things should not be changed. This is set in the Model Settings Properties Panel
Allows you to imbed an iframe into an interface page supporting surveys and inclusion of content from other websites on the interface. See iframe(interface) for more information.
The messages related to units issues for unit converting flows have been improved. Checking has also been added for conveyor transit times, conveyor capacity limits, conveyor inflow limits, and oven cook times.
Selecting a text color close to white no longer requires that you set the background in the editing window to see the text. Instead the lack of contrast is detected and a different background used automatically. See Text Box Properties Panel for more about Text Boxes.
The legends now use a square instead of a line segment to show what is being displayed. See Scatter Chart
and Bubble Chart for details on these two graph types.
You can now see results for arrayed variables and adjust inputs via knobs when using Stella live. The array elements being displayed or changed are determined by the selection you make in the Results Panel. When you open a model the first elements of each array will be selected.
By using array wildcards you can set up graphs, tables, and other output and input objects to display different elements of an array based on user selections. On the model layer this works very much like Stella Live with arrayed variables, on the interface it provides flexibility in page design and can also be used to simplify multiplayer game design as described in Using Wildcards for Multiplayer Games. For more information see Wildcards.
Place holder variable allow you to create graphs, tables, and other input and output objects that can be used with different variables based on selections you or an interface user makes. This makes it possible to reuse parts of an interface page, or an entire page, to represent different parts of a model. It also allows the creation of graphs, tables, and numeric displays on models that can be switched by changing which placeholder variable is selected via the Results Panel. For more information see Placeholders.
Confidence bounds allow you to see how much an optimization parameter can change in order to have a specific influence on the resulting payoff. Most commonly they are used to bound parameter estimates resulting from a calibration, but they can also be used in outcome optimizations. For more information see Calibration.
We have improved the reporting of information from optimization by writing it to the Optimizer Messages which allows you to see more clearly the results, and also to look back at previous optimization runs in an organized manner.
We have added the ability to export the set of variables that have been changed on the interface, both constant values and graphicals. This makes it possible to save the settings for a run made on the interface and then reload them at a later time. See Actions (Interface) for details.
We have improved simulation speed and model save time for large models with complex equations.
Team and player assignments allow you to set up classrooms with individuals assigned to specific teams for a multiplayer game. See Team and Role Assignment for more discussion.
This new builtin allows tracking of the run number within a sensitivity run. This is useful if you want to set something specific, such as a noise seed, based on which sensitivity run is occurring. See Specialized builtins for details.
The SELF builtin can now be used in the ENDVAL builtin, allowing customized definitions of RUNCOUNT. See Data builtins
for more discussion.
The Scatter Plot and Bubble Chart now allow you to specify the time range from which values should be drawn. See Graph Settings Properties Panel
Calibration is the process of adjusting model parameters to make the behavior line up with a target, most commonly measured time series data. It is now easy to set up payoffs and use the optimization engine in Stella to accomplish this. For more details see Calibration for more discussion.
Time varying values allow you to have variables take on different values at different times based on imported data. This is useful as a mechanism for bringing in a sequence of decisions or controlling values, and also loading in data to be used in calibration. See Import Data dialog box for more details and Defining Calibration Payoffs
for the use of imported time varying data in payoff definitions.
The -ro option has been added to the command line to run optimizations. See Running Models Using the Command Line
for details.
The same option has also been added to Stella Simulator, as has support for sensitivity and more control over initialization. See Stella Simulator Arguments for more details.
Print and Print Preview have been added to the File menu on the interface window. These will print the pages currently displayed in the Page Preview Panel. See File Menu
There is an additional option to use Sobol sequences when preforming multivariate sensitivity. Sobol sequences are designed to maximize the exploration of multidimensional parameter spaces. See Sensitivity Specs Panel for more details.
It is now possible to replace a run with another run so that any graphs or tables referring to the run will be updated. For example, if you have a run named base, you can have the current run replace it. For details see Data Manager
You can now specify the units of measure for a User Macro based on the units of measure of the arguments to the macro allowing full checking of model units. See Working with Macros for more discussion.
There is a new function INTERPOLATE that will take an N dimensional set of points and return the value derived by interpolating between these point values. In one dimension this will act the same way that a graphical would on a vector of numbers. In higher dimensions the interpolation is between planes (or hyperplanes) of the different dimensions. See Array builtins for more details.
You can now set runs to start part way into the simulation when working on the interface. This is convenient if you want users to start with some results already available. There is also an option to restore inputs when starting new runs, which is very useful for multiplayer gaming. See Interface Settings Properties Panel for more details.
The shape tool makes it easy to add vertical and horizontal separators on interface pages as well as to include outlined or shaded ellipses (including circles) and rectangles. See Shape (interface) for more discussion.
There is now an option on Graphical Inputs to display the current x and y values as the user drags the points in the shape. This is especially useful for discrete graphicals. See Graphical input (Interface) for more discussion.
You can now control when hover tips appear on sliders (always, never, or when the user is dragging the slider). See Slider (Interface) for details.
You can now specify number format for the numeric display in the properties panel. This allows you select multiple numeric displays and set the formatting options for all of them together. See Numeric Display Properties
If you include Loop Indicators on your model they will now be active when the model structure is presented in either a model view or on a story in the interface. See Loop Labels for more discussion.
Causal loop diagrams created in The CLD Window will now have NAN equations automatically added. These will simplify the inclusion of CLDs in simulating models as they will no longer create invalid equation. The NAN(a,b) format can be added by hand when working in regular models (see Creating CLDs) .
Stella will now work with the features in the newly released Mojave operating system on the Macintosh including the dark mode interface selection.
When you replace the contents of a module using the Import button any cross level connections between the module and the rest of the model will be retained as long as the names in the model for inputs and outputs have not changed. See Module Properties Tab for more discussion or Agent Based Examples for a typical usage.
You can now ask for a new causal loop diagram and have the simplified toolset necessary for creating causal loop diagrams. That toolset (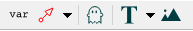 ) makes the creation and editing of CLDs quick and easy. It also matches the toolset of the Online CLD Editor. For more information see
The CLD Window.
) makes the creation and editing of CLDs quick and easy. It also matches the toolset of the Online CLD Editor. For more information see
The CLD Window.
You can now set the color that a switch on the interface displays when it is on. See Switch (Interface) for details.
You can now set the line color for the graphical input on the interface and also specify a fill intensity to display color below the line. See Graphical input (Interface) for more detail.
The Allocation Input object now has the option to computer only integer values allowing more control of both the values and the label appearance. See Allocation Input (Interface) for more details.
There is now a menu option to download the help files as a zipped archive for use offline. This allows you to view the help files locally when you do not have an internet connection. See Help Menu for details.
We have added to the options for sharing Models and CLDs online allowing you to give other people access to your work without marking it as creative commons. This option is not available in the free online editor. See Sharing Models Online for more discussion.
If there are long variable names in the causal lens, you can now hover over them to see the full expanded name. See Causal Lens™ for more discussion of the Causal Lens.
When a conveyor has multiple leakages with different leak zones you can now specify whether the leakage fraction on later leak zones applies to the inflowing quantity or the quantity that has remaining after the earlier leakages. See Traditional Conveyor Computation for more discussion.
The Interface has a new tool used to add a set of navigation links to an interface page or template. The bar of navigation links can appear as a row of tabs or buttons. The styling includes radius corners and spacing. For more details see Navigation Control (Interface).
Spell check is now available for variable names, documentation, and labels. You can select different dictionaries in the Preferences Dialog and correct misspellings using the Context Menu.
It is now possible to turn modules on and off in Stella Live, while paused, and on the interface, including in storytelling (see Running Modules for more discussion).
Leakage computations on conveyors with a variable transit time have been improved to more accurately reflect the leak fraction or rate. See Traditional Conveyor Computation for a more detailed discussion of leakages and conveyor initialization and computation.
Encapsulation allows you to take a selection of variables, or a sector, and automatically put them into a module with the appropriate cross level connections into and out of it. This makes it easy to simplify models that have too much detail built up in any given module. For more details see Encapsulating Structure.
You can now create a container that includes both graphs and tables making it easier to provide the output you want without using up real estate. See Graph Series Property Panel and Table Properties for more details.
Large models should now open more quickly.
You can now set interfaces to scale prepositionally when they are deployed. This makes it easier to have interfaces that work on different devices without having to limit the minimum or maximum size (another added scaling capability). See Resizable Interfaces and the Resizable Options dialog for more information.
You can now create reusable pieces of model structure that can be used the same way that the builtin functions are. This allows you to create customized versions of commonly occurring patterns such as cascaded delays as well as more specialized functions. See Working with Macros for more details.
Bubble charts allow you to display three different dimensions of attributes on a single graph. These graphs represent a snapshot of values at a time and will animate during simulation or when dragging the time slider. See Bubble Chart
for more detail.
Scatter charts can now have more than a single entry. This allows for comparison of x and y values across different runs or comparison of different sets of x and y values. See Scatter Chart for more discussion.
It is now possible to import data with arbitrary time values rather than requiring a uniformly increasing time axis. This makes it easier to accommodate missing values as well as values from different data sources. See Data Manager for more detail.
Stashable graphs and tables allow you to hold on to run results that are of special interest, while displaying the current run at all times. This is a convenient way to collect a sequence of interesting outcomes, and replaces the old functionality related to persevering and releasing data. For more information see Stash Data for more discussion.
It is now possible to peek into modules without navigating into them. This allows you to see what is happening in a module while still looking at what is happening on the parent model of that module. This allows you to make changes in Stella Live and see the consequences of those changes in another module. It also allows you to get an overview of module structure without losing your current visual focus. See Picture in Picture Module Viewing for more details.
Many of the panels now include sections that can be collapsed if you do not need to refer to them. This decreases the amount of information displayed on the panel and thus easier to work with. See Stella Modes, Views, and Panels
for more details.
A new feature has been added that allows you to compare the model you currently have open with another saved model. This is a convenient way to see what changed have been made for models derived from one another or a common source. See Model Comparison dialog box for details.
You can now zoom in on the displayed time in the Results Panel and Causal Lens. This makes it easier to trace down sources of behavior at a point in time, as well as seeing changes in behavior between multiple runs. See Results Panel
and Causal Lens™ for details.
We have added options to the equation viewer to make it easier to provide written model documentation to meet the requirements of peer reviewed journals such as the System Dynamics Review. See Equation Viewer for more details.
There is now an option to display sliders vertically as well as horizontally. See Slider (Interface) for more details.
You can now specify that graph be drawn without connecting the points into line. See Graph Series Property Panel for more detail.
There is a new option to have buttons change their appearance as the mouse cursor passes over them. See Styles Tab for details.
When you select 3 or more objects on the interface there is now a menu option to either align or distribute those objects to clean up layout. Details are available in Context Menu.
You can keep the movement of objects completely horizontal or completely vertical by holding down the Shift key. This works on both the model and the interface.
The loop indicator now works by selecting all of the elements you want highlighted. This allows you to select more specific loops or parts of structure for display. See Loop Labels.
The find will now retain what you are searching (Variable Name, Equation or Documentation), the order in which to display results, and whether to search in the whole model, the current module or the current module and modules it contains.
You can now provide an external list of parameters to change when running sensitivity analysis, and we have changed the sampling for Ad-Hoc and Incremental when running a limited number of runs to better support random selection of discrete values. See Sensitivity panel for more details.
We have made a number of internal improvements to the security settings (see Model Security dialog box) and fixed issues that arose from specific character combinations in low security passwords. One consequence of this is that models saved in the current version using security settings will not open in versions before version 1.7.
In addition to being able to run optimizations over sensitivity runs you can now run an optimization within each sensitivity run. This is a convenient way to see how the optimal parameters found vary based on other model parameters or noise seeds. This is set up in the Sensitivity Specs Panel
It is now possible to add constraints to differential evolution optimizations allowing the specification of inadmissible search spaces without degrading the efficiency of the search. See Optimization Specs for details on setting this up.
The find tool now makes it easier to look for content that appears in equations and documentation by allowing you to specify search terms within these. See Find window for more details.
A Manage option was added to the right click (Ctrl-click/⌘-click) menu item for formatting items in graphs and tables. This will open the Manage Time Labels dialog box allowing you to add and modify formats as well as changing the default time format.
The scroll position on the table in the Results Panel is now retained when moving between variables.
Options have been added to the Equation Viewer to make it easier to create model documentation that meets your needs. It will now display optional variable usage and provides increased control over annotation. See Equation Viewer
for more information.
Sketchables with Fill
You can now fill in the area underneath a sketchable graph. This is especially useful when using discrete graphicals as it provides a sharp contrast between adjacent values.
There is now an option to see both the inputs to each sensitivity run as well as the outputs in the currently displayed graph or table. See Sensitivity Parameters dialog (Model Only) for more detail.
If you click on an empty part of the model when using the ghost tool the Find dialog will come up allowing you to ghost a variable without first navigating to it.
Under the Window menu on the model and the interface, the Restore Window Layout option will reset all window, panel and tool bar positions to where they were when Stella was first installed (isee systems default settings). See Window Menu
In the Zoom control, a new option has been added to automatically adjust the zoom level of the model diagram or interface page so that all objects will be visible within the viewable space without needing to scroll. See Mode Toolbar for details.
A combined View Results and Causal Lens has been added to the Online Model Editor. See Getting Started Online.
You can now specify a model level default number format that will be applied to all variables instead of having to do this variable by variable. This is done in the Model Settings Properties Panel. The options are the same as they are for each variable, and variables can still be set individually as well.
Instead of limiting output formatting to use a $ or % you can now specify arbitrary prefixes and suffixes for output numbers. See Scales and Ranges Tab for more discussion.
You can now format time to display years, months and days and not simply decimal values. See Setting up Time Bounds for more discussion.
You can now find what graphs or tables (or interface object) a variable is used in by right clicking and selecting Find Uses on the right (Ctrl) click menu. See Context Menu for more details. You can also locate exported tables from the Export Data dialog box
The performance of published models, especially simulation speed, has been dramatically improved and will, with a modern browser, match the performance on the desktop.
It is now possible to import and export data from the interface for published models. These are both set up using a Button (Interface). When the button is clicked the user will be prompted for a file to upload or save to. Only .csv files are supported on the interface. See also notes in Creating Import and Export Files.
The new Simulation Speed control allows you to let the interface user set the speed at which the model simulates. See Simulation Speed for more details.
You can now have objects be made conditionally visible based on variable values, or the role in a multiplayer game. This allows customization of the user experience based on the state of a simulation. See Object Visibility (Interface) for more details.
Much like the progress bar in the development environment the Display Time object shows progress during a simulation and allows the user to scrub over different times in the simulation. See Display Time (Interface) for more details.
You can now add a button that will play a sound, and have a sound be played in response to a simulation event. This works the same on the desktop and for published models, though supported sound formats vary by browser. See Button (Interface) and Simulation Event Action dialog for more detail.
You can now display equations, units of measure, and any documentation provided for a variable in a Model View. This material is displayed as the mouse moves over the elements of the model. See the Model View documentation for details.
The NEGBINOMIAL (negative binomial) builtin has been added. This returns the number of failures that occurred getting to a specific number of successes for a given probability of success. SeeRandom builtins for more information.
You can also specify a minimum, maximum and sampling interval so that it is easy to create truncated or sample distributions in models, and truncated distributions for sensitivity. See Random builtins for more discussion of truncation and sampling.
You can quote an array dimension name and element names by putting double quote around them (as in "1-2"). This capability is in place primarily to support the importation of models translated from other languages. If you do create labels with quotes the model will not work in previous versions of Stella.
The Histogram has had options added to appear as a probability density function (pdf) and cumulative density function (cdf). See Bar Graph for further discussion.
Highlighting of variables is now easier to find even in dense models with lots of color.
It is now possible to pass parameters to a simulation set up with data collection by appending them to the URL for the model. See Data Collection for details.
Note that the BINOMIAL and GEOMETRIC builtins were not behaving the way they were documented. The probability parameter was being multiplied by DT prior to execution. If you are using these with a model that has DT of 1, there will not be any change in behavior. Otherwise, multiply the probability by DT to get the same behavior. The MONTECARLO builtin will also allow you to specify a success probability that is limited to 100% per DT, not 100%*DT per DT as it previously did.
Models from versions prior to 1.6 can be opened and saved in 1.6 then reopened in previous releases and should be unchanged. As always, new features available in 1.6 will not be recognized in previous versions. Thus, for example, additional arguments to NORMAL and other random number generators will be treated as errors in earlier versions of the software.
The new time and number formatting options introduce more complexity when models are opened in previous versions of the software. By design, if a model from version 1.5 is opened and saved in 1.6 it will reopen unchanged in version 1.5. However, if you make changes to the default number or time formats (see below) in 1.6 then those changes will be lost when opened in 1.5. When reopening in 1.6, you will need to add back in the default format changes. As you add in additional number and time formatting options this becomes more complicated and it is possible to lose additional time and number formatting information. Therefore, if you are planning to work with people using prior versions of the software it may be simplest to not set the model level defaults for time and number formatting.
Version 1.5.2 contains defect fixes only, and no new features.
The behavior of models running in Flight Sim mode has been modified so that they respond continuously to input changes rather than momentarily pausing. See Flight Sim Mode for details.
The functionality to create an import file from the Parameter Control panel has been updated to only save values that are changed. This will allow you to easily create import files based on optimization results and also to create an import file that captures a snapshot of the interface input control settings. See Parameter Control Panel for more details.
Context sensitive help is now available in most dialogs as well as the properties panel.
Optimization allows you to find a set of parameter values (model constants) that maximize a payoff you defined in terms of other model variables. This is similar to running sensitivity that is guided to achieve specific outcomes. See Outcome Optimization for more details.
The output of graphs and tables has been enhanced to support a number of formats that can be very helpful when working with a large number of sensitivity runs.
Confidence bounds allow you to see what percentage of runs leave values in different ranges at each point in time. This allows for a clear visualization of the divergence or convergence of values over time given different assumptions on parameters and also how concentrated the values are at any point in time. See Graph Series Property Panel for details on turning these options on. The same information can be presented in tables identifying numeric values for the different percentiles (see Table Properties for details).
Histograms are created by collecting results from different runs and grouping them into buckets for different ranges. This allows you to see how many runs fall into each of the ranges. Histograms are available as an option on the Bar Graph
Correlation plots allow you to see how one variable correlates with another over a series of runs. This is done with scatter graphs by turning on comparative and checking the option to show only a single value. See Graph Series Property Panel for details.
When a model is paused, the values of all variables, stocks, flows and converters, are available at the time of the pause. On the model window these values will be updated if you make changes to any model parameters. For tables and graphs, the interface will report only stocks at the current time, but other output devices, such as numerical displays, can be set to report the precomputed values. For more information see Initialization and Pausing. The option to pause before computing flows has been removed as this is no longer necessary.
These are now accessed through the model analysis tab ![]() of the properties panel for the model. Use the sensitivity tab to access sensitivity setup. See
Sensitivity Specs Panel for more detail.
of the properties panel for the model. Use the sensitivity tab to access sensitivity setup. See
Sensitivity Specs Panel for more detail.
Clicking on the ? icon in any of the panels will now take you to the help entry specific to that panel.
You can now specify a save interval. This is useful for decreasing the storage requirements for large models and also for keeping data collection working well. See Model Settings Properties Panel for more information.
If you are using the tabbed or dropdown styles for selecting between multiple graphs you can now set a label for the tab or dropdown entry that is separate from the graph/table title. It is also possible to reorder the entries. See Pages Styles (Interface), Graph Settings Properties Panel, and Table Properties for more discussion.
You can now use keyboard shortcuts to select tools when building models. See Select Stock and so on in Keyboard Shortcuts and Key Combinations for details.
You can now rename the graph and table pads that show when the graph or table is minimized. Editing works just as it does for variable names.
You can now use the annotation button to display a variable's documentation, equations and units of measure. See Annotation Button (Interface) for more details.
The units of measure now appear in the graphical panel - making it easier to there are units issues with graphical functions. Also, if the equation for a graphical has an error the panel will open on the equation instead of the graph.
When setting interface page size, existing content may restrict how much it can be adjusted. If a page has content that would be outside the page on resizing you will not get a message indicating the reason the page size was not able to be changed as requested.
A new Loop Label object has been added to the mode editing toolbar. This allows you to label loops and will highlight the links in the loop when the mouse passes over it. See Loop Labels for more information.
A new navigation button has been added to the model to allow position changes to predefined locations or variables. These can be useful as shortcuts for navigating through large models. See Navigation Button (Model) for more details.
Use NAN to set a variable value so it will not appear on graphs. Use CLOCKTIME to return the current time on the computer the software is running on.
There is now an option to fit the graphics content to the frame. See Graphics Properties for more detail.
In addition to publishing model interfaces, you can now create multiplayer games in which players connect from their own browsers, make decisions, and indicate their readiness to proceed. The model then uses decisions from all of the players as inputs for the next step in the game. Multiplayer games can be published to the isee Exchange under the Creative Commons license, with some limitations on model size. See Multiplayer Games for more details.
It is now possible to create sophisticated animations based on SVG graphics files. These animations can include color, size, and rotation. See Animation Object (Interface) for more details.
When you add a button to your interface, you can now set conditions under which each of the actions will be executed. This is especially useful in multiplayer games. See Button (Interface) for more detail.
Published interfaces can now be made resizable, allowing them to work well on a variety of devices. For details, see Resizable Interfaces.
You can now collect data on the use of your published interfaces, including the results from different users and the time spent on different pages. Data collection is available through an isee Exchange subscription. There are several reporting options available for analyzing the data. For more details, see Data Collection.
The modeling language has been extended to allow the use of expressions inside of the array functions (such as SUM(a*b)) to take an inner product. An inner product operator has also been added for 1 and 2 dimensional arrays. See Working with Arrays and especially Specialized Array Manipulation for more discussion.
There are new options for navigating through multiple pages of graphs, tables, and input devices. Rather than the standard ![]() and
and ![]() buttons, you can use tabs for each page, or a dropdown list including all pages. This is applicable to graphs, tables, group inputs, and arrayed inputs, and is selectable from the properties panel for each. See
Pages Styles (Interface) for details.
buttons, you can use tabs for each page, or a dropdown list including all pages. This is applicable to graphs, tables, group inputs, and arrayed inputs, and is selectable from the properties panel for each. See
Pages Styles (Interface) for details.
When you connect a variable to a module, or a module to a variable, you will see a menu item allowing you to select which variable within the module to connect. This will appear only if there is something marked as an input or output within the module that has not yet been connected.
We have made a behavior change when you are using a separate initialization equation for a graphical function variable. Previously, the I equation would determine the value of the variable. Now the I equation determines the input into the graphical function.
Graphs will now use the initial values computed in the background. For bar graphs and pie charts, this means they will be populated with initial values before and after running an output restore. Regular graphs will not draw, but they will have a scale. This is true for models and interfaces, including published interfaces. Note that changing a controlled value will no longer generate a new initialization. See Known Issues for more discussion.
We have adjusted Stella Live to be less sluggish on larger models, and also to give visual cues when the model is in the process of computing. In particular, as you dial a knob, while the software is computing the graphs, over model elements will be displayed in gray instead of red. This indicates that the graphs are potentially out of date relative to the value showing for the knob.
If you try to make a connection that would cause a circularity the list of variable involved in the circularity is not displayed in a dialog box.
Hovering on a connecter into or out of a module will now show which variables are being connected.
You can now navigate out of modules using keys. To get to the containing module use Ctrl+Up Arrow (⌘+Up Arrow on the Mac). To get to the home module use Shift+Ctrl+Up Arrow (Shift+⌘+Up Arrow on the Mac). See Keyboard Shortcuts and Key Combinations for other shortcuts.
The three line limitation on variable names has been removed.
You can now add polarity symbols to flows.
On the interface, the auto-alignment grid now includes objects in templates so that you can more easily manage page layout.
Keyboard scrolling using the arrow keys has been improved.
Array names and elements have been added to the auto-complete when working with arrayed equations.
The scales and ranges tab has a new icon (![]() ) that is more representative of its function.
) that is more representative of its function.
We have substantially improved the performance of published models of significant size.
You can now edit and work with your models online by logging in through the isee Exchange. See Stella Online for more details.
Available for both the model and interface, we've added two new options for displaying results. The Pie Chart is a new output format for the display of variable values at a point in time. The Area Graph allows you to display a series of graph values stacked on one another, with distance between them based on the values of the variables. Both of these are configurations of graph objects and can be selected in the Graph Series Property Panel.
The new Allocation Input (Interface) object allows users to set values for inputs that need to add up to a set amount. It's implemented as a draggable pie chart, with adjacency determining the sequence in which other inputs change as the user makes adjustments.
A reset button (![]() ) has been added to interface input objects, allowing them to be reset to the model value by the user (the button also marks the control as changed). The option to use this is set in the
Interface Settings Properties Panel.
) has been added to interface input objects, allowing them to be reset to the model value by the user (the button also marks the control as changed). The option to use this is set in the
Interface Settings Properties Panel.
Buttons on the interface can now execute either an import or an export of an on demand data link. These actions do not do anything for published models. See Button (Interface) for more details.
Graphical input objects on the interface can now be changed either by tracing the shape, or by switching the Table view and entering xy pairs. See Graphical input (Interface) for more discussion.
You can now import both the x and y axis for graphicals by putting :x and :y after the name of the graphical in successive rows or columns. See Creating Import and Export Files for details. The import options now handle arrayed inputs more consistently and better manage compatibility between US and European number formatting.
The Parameter Control Panel now highlights variables that have been overridden on the panel, making it clearer what has been changed (this is especially important for values already imported).
Any graphical functions that use a constant as an input will now be marked as invalid. This makes it easier to uncover issues where TIME might have been the intended input. If you do want a constant as an input, you can use an expression (as in 0+0) to prevent the error.
The INIT and ENDVAL builtins can now take an expression in addition to using a variable directly.
You can now control the colors and line styles for the different lines appearing in comparative graphs. This is set for each model (and there is a default setting for new models).
Window positions are now preserved for all dialog boxes and panels, making it easier to get back to the same setup you've been working with.
By right clicking on a graph, table, or numeric display (or any interface control with a variable in it), you can jump to the definition of that variable in the model (not available for Stella Designer).
You can now format multiple items on a graph or table using the right click menu.
You can now preserve graphs and tables with a single click so that they won't change with new runs or be cleared when you restore outputs. This is done from the Graph Series Property Panel.
We've added the functionality 'import runs from external data sources' to the Data Manager. This makes it easy to compare results with measured data or with results from other models.
A number of other improvements have been made to the Data Manager, giving you more control over the way in which runs roll off the list and what runs are displayed in graphs and tables.
The import and export dialogs have been improved to make it both easier and clearer to set up imports and exports. The use of temporary imports has been reintegrated into the import dialog so that everything is in one place.
The parameter control window has been enhanced so you can see the original model value, and to make it easier to reset and control different variables.
Any variables appearing in the parameter control window are also marked on the model diagram ( ).
).
The simulation speed slider has been replaced with a field that allows you to input how many seconds you would like the simulation to take.
A speedometer style gauge has been added to the interface to allow you more variety in presenting results.
Spatial map has been integrated into the interface, making it easy to present spatial information in an appealing manner.
An Array input device has been added to allow sequences of array values to be input into the interface.
Explore mode on the interface has been replaced with Experiment Mode, which behaves the same way as Presentation mode does, making it easier to test your interface.
There is now a button action to reset a variable to its equation (or imported) value.
The switch object can now be configured to appear as a checkbox.
You can now optionally animate diagrams shown in the Model View, including those shown for storytelling.
The Model View controls have been improved to make it easier to include model elements on interface pages and stories.
The Pages Panel (Interface) can now be collapsed to allow you more room for editing.
Before running, control changes will update model values including numeric displays, speedometers, and spatial maps, allowing users to see the initial conditions that will be used as they set things up.
Sketchable graphs update automatically in Stella Live.
Stella Live executes more quickly during development and on published interfaces.
Embedded images display more quickly.
The thumbnail drawing is much faster.
Divide by 0 errors are now reported on the interface.
Models are continuously reinitialized as they're built so that you can see the effects of equation changes immediately by hovering over a variable.
There is also an option to perform a new simulation each time you change model structure, which allows you to see the effects of changing connections and equations immediately.
Circularity checking and reporting have been improved and now detect subtle initialization dependencies related to leakages and discrete stock equilibrium initializations.
Circularities are now reported one loop at a time, and all the variables in the loop are marked invalid, making it easier to visual the loop.
Non-stock equations can now specify an initial value to be used when the model stocks are initialized. This is very helpful for breaking initialization circularities that have been identified.
We have added a // operator which works the same as SAFEDIV, giving 0 instead of an error when dividing by 0.
Divide by zeros are more accurately reported, even when they occur within expressions such as MIN. Legacy models will automatically have some of this reporting masked to maintain compatibility.
Checking Unit Consistency now reports where in equations unit inconsistencies are detected.
For locations that use a , as a decimal separator, you can now enter equations using this, as well as ; as an argument separator. This can be turned on and off in the Preferences Dialog.
The registration dialog behavior has been changed so that clicking twice on the button to open a web page does not cause two or more activation requests to be sent to our server.
Sliders and Numeric Inputs now allow you to specify the width of the slider or input box in order to get better horizontal alignment when placing one object below another.
Sliders, Numeric Inputs, Knobs and Switches on the interface now have an option to wrap text.
The Causal Lens now highlights the path of selections you have made to make it easier to see the sequence of causality.
The interface development tools are all new. The new interface development and deployment capabilities take you from design to presentation and, optionally, the web, quickly and cleanly. See Building Interfaces for more detail.
Interfaces developed in previous versions of the software will be translated, and most of their functionality retained, though some adjustment will be necessary to get optimal results. See the notes on Using Version 10 Models for more comments on interface translation.
Version 1.1 adds a number of new and updated panels that can be used to analyze and navigate your model.
The Causal Lens™ displays graphs for a variable and the inputs to that variable, helping you to better understand the sources of model behavior.
The Results Panel now includes both a graph and a table, allowing you to easily look at specific values at specific times. There's also a checkbox to not round the scales, which is helpful when looking at variables with limited movement through a simulation.
The Message Log records any variables that go above or below their specified ranges, as well as graphicals with inputs above or below their specified minimum and maximum x values. The same log is also used to report messages about anything that happens when opening a model.
The Parameter Control Panel allows you to see what variables are changed relative to their model equations, and also make changes to those variables.
The Selection History - Obsolete panel keeps track of which variables you've selected, making it easier to go back and see where you've been. Click on an entry to take you back to that variable.
We've improved selection highlighting to make it easier to see which variables have been highlighted. This is especially useful as we've added a number of new ways to navigate between variables.
You can right-click on a variable in an equation and jump to that variable. There's also a Causes/Uses menu to navigate to variables that cause, or are used by, the variable you're looking at. See the discussion on the Equation Tab of the Properties panel for more details.
We've improved the error message reporting in equations, and made this reporting somewhat stricter, especially around the MIN and MAX functions, to prevent ambiguity.
The units messages now tell you how many variables you have left to define units for. If you haven't defined units for any variable, the dropdown simply reads Define Units.
There are no longer any restrictions on what names you use for variables, except that they must be unique and not conflict with any Builtins. When used in equations, variables that have operators or other characters will be quoted and escaped. (If you type them in, you'll need to do this yourself, but it happens automatically if you choose them or use autocomplete.) Variables with a period (.) in them will also be quoted when displayed on the diagram (this is to prevent confusion with module qualified names).
Models open significantly more quickly than before, letting you get on with development. Exporting of data is significantly faster and will happen in parallel during simulations.
An analog to the SUM function takes the product across elements of an array.
An option has been added to the Preferences Dialog that turns off Stella Live when in Explore mode. This allows you to work with larger models and make changes on the model window, but only simulate them when you explicitly request a run.
You no longer need to go to the home module to change run specs or other model wide settings. These are available in the panel from any module.
You can now order equations by sector, and also view values in the Equation Viewer. Complete information about model size has also been added to the end of the equation listing
We've redone what used to be called Posters or Simulation Messages into an easier to use system of Simulation Events that can be applied separately to the model and interface. Existing models will have these converted to the new format when opened with the new products. Navigation events will need to be redone - see Simulation Events.
We've added new export formats to export a single value or set of values at a time, and improved the way tables are specified for exporting - see Export Data dialog box
Version 1.0.3 is designed to work well with high resolution displays, including Retina displays on Mac. The icons on the screen will automatically be enlarged to accommodate displays with high pixel counts, and the diagrams will be presented so that they're easy to read at default zoom levels.
We've updated the icons used throughout to be clearer and more consistent, in addition to working better on different resolution monitors.
The movement back and forth between Edit and Explore modes has been streamlined. Changes you make to constants in Explore mode, by adjusting knobs or entering values in the Results Panel, will persist if you enter Edit Mode and then go back to Explore Mode. Modifying an equation will reset any value you set in explore mode, but only for that equation.
You can set values for arrayed constants in the Results Panel in Explore mode (arrayed constants don't have adjustable knobs). Just open the results panel and click on the constant you want to change. You can select the array entry to change from the dropdown at the top of the results panel.
Constants now have an increment setting that can be used to control the number of values they'll take on when changed via a knob in Explore Mode. This can be very helpful if you want to limit the number of values that a constant can take on, and will even allow for the addition of switches that take on only 0 and 1 as values. The increment is set in the Scales and Ranges panel.
This functionality has been moved to the Panel to make it easier to use. Rather than opening the import dialog, open the Properties Panel on the model and there's a new tab ![]() , to make temporary changes, including importing interface settings from STELLA and iThink Version 10.1.2 models.
, to make temporary changes, including importing interface settings from STELLA and iThink Version 10.1.2 models.
Clicking on the add variable ![]() button in the graph and table panels will now open up the Find dialog, making it easier to select and add variables.
button in the graph and table panels will now open up the Find dialog, making it easier to select and add variables.
Copying model diagrams into the clipboard is now more sensitive to context, and will remove the borders from graphs when they're copied by themselves. This makes it easier to paste your content into other applications.
Now when opening a saved model, it will open in the same view in which it was saved.
Substantial improvements have been made to Stella Professional's computation engine. Not only will models open more quickly, but large models should simulate three to eight times faster than in the previous version. This allows you to get more done more quickly.
A new function, SAFEDIV(<numerator>, <denominator>, [<onzero>]), has been added, which allows division in cases where the denominator might become 0. When this happens, the function will return 0, or the optionally specified third argument. Use this to prevent simulations stopping because of a divide-by-zero condition.
The Import functionality has been enhanced to allow you to import values without making any changes to model structure. This is useful for running experiments in which you don't want to change the model, but just see the results of changing constants and graphical functions. This also allows you to override computed variables with a constant value, much like you would when, for example, attaching a slider to a converter on an interface.
An option has also been added to the Import dialog that will read interface control values from a model created in version 10.1, and create a temporary change file. This allows you to simulate models in Stella Professional and get the same results that they generated in the Version 10 products.
The Alt key now works by holding it down, rather than tapping it, when you want to repeat a build step, such as drawing connectors between variables.
When you position the mouse over a connector handle (or arrowhead), the color of the connector will change, to indicate that it's active and can be dragged. Similarly, when you position the mouse over a variable name, the name will be highlighted with a box to indicate it can be repositioned. This makes it much easier to adjust model layout, especially for densely connected models.
A Windows menu has been added to allow you to more easily navigate between models when you have multiple models open. Under the Windows menu is an item to open the Results Panel. A Run Specs menu item has been added to the Model menu, as an alternative way of opening the Run Specs panel.
Registration information can now be accessed and changed through the Registration dialog box opened from the Help menu. This allows you to change your registration information and unregister the software from one computer, so you may use it on another.
When you place a connector, the style panel will contain an option for a Delay Mark. See Styles Tab for Building Blocks for more details. The polarity markers can be shown using either +/- or s/o, as specified in the Model Settings Properties Panel
Set this on the Model Settings Properties Panel to shorten the names displayed in graphs and tables (e.g., have profit be displayed instead of accounting.profit).
You can now create a Sketchable graph for any graphical function in the model, without needing to add another variable for comparison. This allows you to use the Sketchable graph as an input control. See Sketchables for more information.