The line graph is the default graph type and displays variables over time. You can make comparative graphs that display the same variable over multiple runs, or you can display multiple variables from the same run. It is also possible to display specific variables from specific runs.
Select the graph ![]() from the Interface Build toolbar, and click on the page at the location you want it to appear (you can also add a page to an existing graph you've already put down).
from the Interface Build toolbar, and click on the page at the location you want it to appear (you can also add a page to an existing graph you've already put down).
Then select the variables you want to appear in the graph. You can include any variables you want. For more information on adding variables, see Graph Series Property Panel.
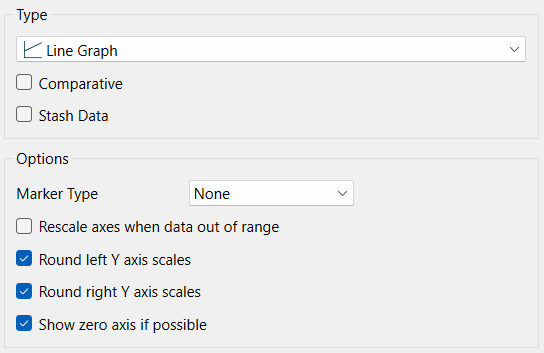
Comparative, if checked, shows multiple simulation runs on a single graph. This option is often used in conjunction with sensitivity analysis. When comparative graphs are generated and sensitivity analysis is turned on, clicking the ![]() button at the top of the graph displays a journal of the most recent sensitivity setup used to create the graph. See Sensitivity Parameters dialog (Model Only) for more information. Comparative is only available when there is 1 variable selected. When you add a second variable it will be grayed.
button at the top of the graph displays a journal of the most recent sensitivity setup used to create the graph. See Sensitivity Parameters dialog (Model Only) for more information. Comparative is only available when there is 1 variable selected. When you add a second variable it will be grayed.
Stash Data, if checked, will provide a stash button on the graph to remember any variables displayed for the current run. See Stash Data for information on this option.
Marker Type determines what will be drawn on top of the lines to distinguish them. Select from None (the default to not add any marker), Letters (to display A, B, C...), Numbers (to display 1,2,3...), and Symbol (to display x, +, /, *...).
Rescale axes when data out of range, if checked, will always show all available data. If this is not checked, and minimum or maximum values have been set for some variables the values may be truncated (their lines will not be drawn outside the specified range).
Round left/right Y axis scales, if checked, will round the values in the associated Y axis so that the scales are easier to read. If not checked no adjustment will be made.
Note This option does not affect any variable for which an individual minimum or maximum has been specified in either the graph definition or the scales and ranges panel for the variable itself.
Show 0 axis if possible, if checked, will display a horizontal gridline at 0. This option only matters when the minimum on the graph is negative and the maximum positive, otherwise the gridline would be displayed anyway.
The options for the line graph series are discussed in Graph Series Property Panel, with additional display options discussed in Graph Settings Properties Panel and the style settings in Graph Styles Tab.
The skechable options are collapsed by default. Click on ![]() to expand it.
to expand it.
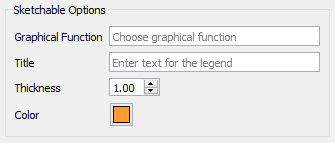
Sketchable options allow you to add a graphical function to the graph and have users sketch the shape of the function on the graph. See Sketchables for more information.
Graphical Function names the variable to sketch. This variable must be a Graphical Function and must have Time as its equation.
Title is the title that will appear in the legend. If left blank, the name of the graphical function will be used.
Thickness is the line thickness of the sketchable curve.
Color is the color of the sketchable curve.