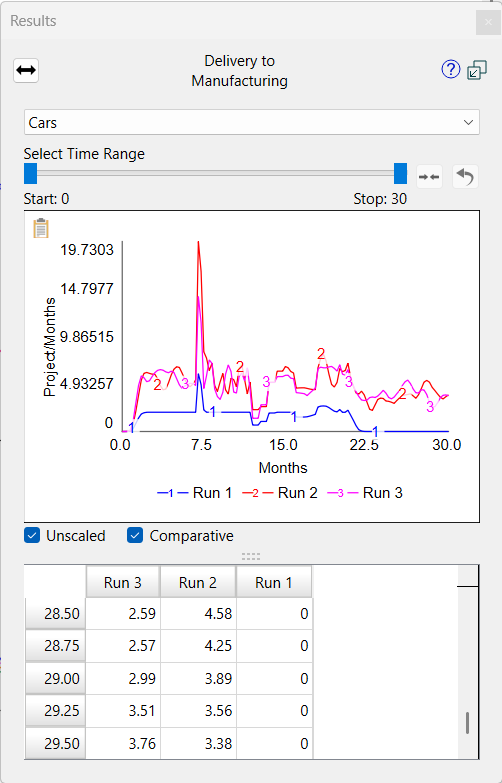
The results panel lets you see graphs of results from the runs you've made.
If there is one variable selected the panel will show the name. If there are multiple variables selected it will display Multi-Selection. If the model was run with Loops That MatterTM Overview active and a conector is selected it will display the name of the link and show the link score (if multiple connectors are selected it will display Multi-Selection).
Use the Causes Uses button (![]() ) to navigate to causes and uses of the current variable. See Causes Uses. This is only visible when a single variable is selected.
) to navigate to causes and uses of the current variable. See Causes Uses. This is only visible when a single variable is selected.
If the variable selected is arrayed, the element being displayed can be changed from the dropdown. There will be one dropdown for each dimension of the arrayed variable. If there are multiple variables selected the dimensions for all of the selected variables can be changed.
If the graph is not comparative and there is only a single variable selected there will also be an All option in the dropdown:
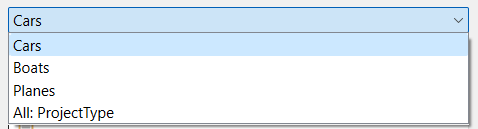
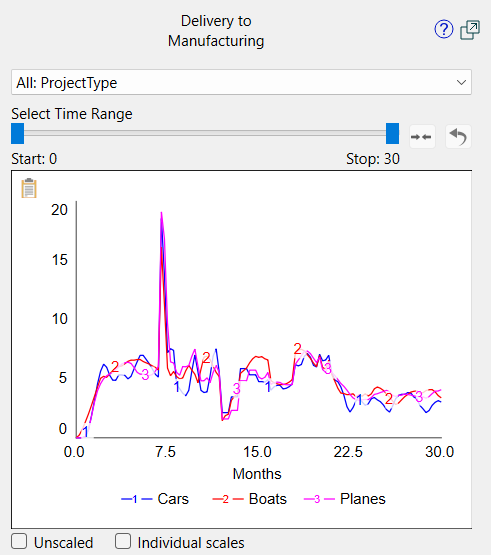
Select this to see all elements of the dimension (e.g. ProjectType):
Note You can change the time labels being used by right clicking on the graph to open a Context Menu.
Drag the handles of the slider (![]() ) to change the time range over which values will be displayed. You can Narrow this range are much as you like by dragging these handles toward one another. After doing this click on
) to change the time range over which values will be displayed. You can Narrow this range are much as you like by dragging these handles toward one another. After doing this click on ![]() to refine the granularity of the handle movement. Repeating this will allow you to view values at specific DTs. Click on
to refine the granularity of the handle movement. Repeating this will allow you to view values at specific DTs. Click on ![]() to view values for the entire run.
to view values for the entire run.
Lock Span, if checked, will keep the amount of time displayed on the result panel constant as you move either handle of the slider. This is a convenient way to move across the time of the run while being able to see more detail about what is happening at each time. This is only available if the time range is not the full time range.
Note If the Causal Lens™ is open when you first open the Results Panel the time range will be set as it is in the Causal Lens.
Check this to use raw scales where the minimum and maximum exactly match the minimum and maximum values being displayed. This can be very helpful when looking at values that change only slightly. Uncheck to get rounded scales that will be easier to read.
Check this to see a comparison of values across different runs. This is only available when a single variable is selected, and when the All option has not been selected on any array dimensions.
Note To see the all option on array elements you must uncheck comparative.
Note You must select a specific dimension (not All) to see the comparative checkbox.
Check this to put each variable (or each element of an arrayed variable) on a different scale. This option is only available when you have selected multiple variables or used the All array dimension.
Check this to show the accumulated value of the variable or variables. This is a quick way to determine the total amount of flows, and also to view noisy data to more easily discern trends. The displayed value will start at the beginning of the time range selected and will include but the first and last value just as the builtin RUNCUM does. When this is selected the units of measure displayed will be multiplied by the units for time, as this is the same as having a stock that accumulates a flow. IF DT is 1, then it is the same as just adding up or counting all of the entries.
In explore mode when the results panel is open on a constant converter or flow, or a stock with a constant initial equation, there will be an editing box to change the value:

Type in a number and pres the Enter key or click on Submit. The model will run with the value you enter. Click on ![]() to put the constant back to its model value. The value you set will be temporary, no changes will be made to the model equations.
to put the constant back to its model value. The value you set will be temporary, no changes will be made to the model equations.
If you open the Results Panel on a variable that is a graphical, a button will appear at the bottom:

Click on this to open the Graphical Editor dialog box and make changes to the graphical. The changes will be temporary, and can be reset by opening the graphical editor again and clicking on reset, or by a restore inputs or reset all devices command.
For more information on working with the Results panel, see Results Panel