In order to import data from an Excel (.XLS or .XLSX) or .CSV file into a model, you need to set up the Excel or .CSV file so that the data are properly formatted. To export data from a model to an Excel or .CSV file, you can use a blank file. The export process will automatically overwrite any information in the file and set it up in the correct format.
Notes: To import data from a file, you have to save the file. Unsaved
changes in a file will not be imported (except for manual imports from an Excel file, which will include unsaved changes).
If you're sharing a model that has automatic import or export links, putting the files into a folder called "Data"
within the folder that contains the model file is good practice. This ensures that the
connection between the model and the file stays active, regardless
of the computer that you're running the model on.
The import file format and export file format are described in detail below.
To import values from a file into a model, the file must contain the names of the variables in the model that you want to import values into, and the values that you want to import.
The variable names in the file must exactly match the variable names used in the model. You don't need to include all model variables in your file; only include the variables whose values you want to import to the model. Model variables that don't appear in the file aren't affected during the import.
Note: You can test to see if any of the variables in the file don't match those in the model by opening the import dialog and clicking on 'import now'. You will receive a warning message during the import telling you what data couldn't be imported.
You can enter the variable names as column headings or row headings (you'll indicate the format you chose when you set up the link to your model). For example, the following Excel worksheet defines the initial values for population (a stock), birth rate (a converter), and death rate (a graphical function), with the variable names in the column headings:
The name of each variable appears as a column heading and the values
to import for each variable appear immediately beneath it. All values
for the graphical function (death rate),
ordered from minimum x to maximum
x, appear under the variable
heading. If the number of values in the import file is different from the number of points in the graphical function, the graphical function will be adjusted to match the number of values in the import file.
The following example shows the same data with the variables as row
headings:
Note that the data in the spreadsheet don't have to start at row 1, column A. The import process searches for names that match variables in the model and then for values below (vertical) or to the right (horizontal) of those names (ignoring empty cells).
Any other entries that don't match model variables will be ignored.
Time varying values are used for that option in the Import Data dialog box and also for loading external data as a run through the Load External Data dialog box. In order to load time varying values, it is necessary to specify a set of values for time which will be used when interpreting variable values. The values for time must appear in the first row or column. For example, you might have:
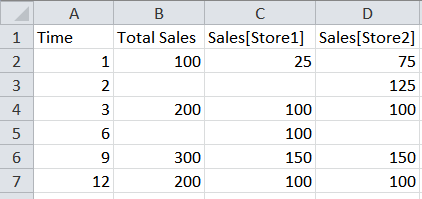
Here the first column is labeled "Time", but that label does not matter. It could also be labeled "Months" which is the default format for exporting values from a run. This means that you can use exported values from a run directly for importing time varying values.
The values in the time row or column must be increasing, but they do not need to be uniform. In the above example the first increase by 1, then by 3. In addition, there may be blank values for any of the variables. These values are considered to be missing. They work the same way that they would if there were no time entry for that time.
The other important difference in time varying imports is that you can't use a one dimensional array slice (see discussion below). Every variable in a time varying file needs to be the fully specified array element.
When you bring in time varying inputs you can specify the interpolation mode for all of the values in the data source. If you want to use a different interpolation more for some of those values you can do so variable by variable. This is done using the : notation after the variable name analogous to that used for graphicals (e.g. sales[1]:r would give raw values):
:c - Continuous. A straight line interpolation will be made between the values. Outside the range the first or last value is used.
:i - Inside. A straight line interpolation will be made between the values. Outside the range the model equation value is used.
:e - Extrapolated. This is the same as :i except when outside the range of included values the slope will be continued.
:b - Backward. This is stepwise backward. The value will be used until a new value is found and that will be used.
:f - forward. This is stepwise forward. After a value is passed, the next value will be used.
:r - Raw. When not precisely on a data point, the model equation for the value will be used (that equation can be NAN).
This specified interpolation mode will override whatever has been set for the file as a whole.
With the exception of time varying values and graphical values, arrays can be imported by specifying 1 dimensional array slices, followed by a column (vertical) or row (horizontal) of values for that dimension. For one dimensional arrays, you can leave off the [*] and just specify the name.
One-Dimensional Arrays
To import values in a file into a one-dimensional array in a model, the file must contain one column (or row) of data for the array. The column (or row) heading specifies the array name. All subsequent columns (or rows) contain the data.
The following example shows a one-dimensional array ("OneD array") set up with a column heading, and with seven specified values.
The following example shows the same array set up with a row heading.
![]()
N-Dimensional Arrays
To import values from a file into a higher-dimensional array in a model, the file must contain one column (or row) of data for one or more one-dimensional slices of the array. Instead of just a variable name, a variable with subscripts filled in has to be used.
In the following example, "Two D array" is a 3x2 array with a horizontal link set up.
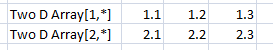 (Horizontal)
If there aren't enough values for a row, the last value will be repeated to fill it out. If there are too many values, the excess values will be ignored.
To import with a vertical link, the data could be laid out as:
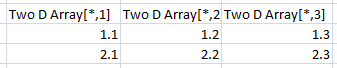 (Vertical)
In this case, the data use the same orientation with the header names changed accordingly. A transpose of the first horizontal data would also work:
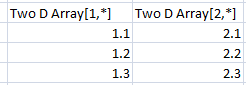 (Vertical, Not Recommend)
The first two of these use the same layout of values as the Properties panel for the variable equation, and are recommended practice. The import template Stella creates uses this layout.
You can use the dimension name or a * to denote the dimension over which the slice is being made. Similarly, if you use array labels, you can use the label or the number to specify which slice is being used.
Consider a three-dimensional array on Size (Small, Medium, Large), Shape (Round, Square), and Color (Red, Green, Blue, Yellow). A horizontal link to initialize inventory would use:
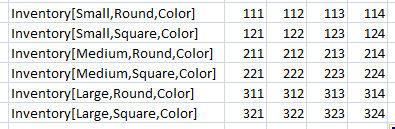
Instead of Color, we could have used * with the same meaning.
You don't need to import all array slices. You can also import an individual array element just by specifying the complete element entry (as in Inventory[Medium,Square,Blue]).
Graphical functions need to specify a sequence of values rather than a single value. Following the graphical function name, enter the y values that will be used (you'll get a message if the number of these entries is different from what's currently in the model if you use Import Now, as described in Manually Importing and Exporting Data).
Note When you are importing values to control variables graphical functions have both that function, and a value during the simulation. If there is only one number it is treated as the value of the variable, if there are multiple numbers, they are treated as the y values for the graphical.
In addition to giving a sequence of y values, you can also specify both x and y values. To do this, simply use the name of the graphical, followed by :x and then :y in two successive rows or columns. For example:
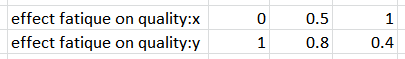
The x and y entries must follow one another directly, and the names before x and y must match exactly.
Because Graphical Functions take many values, you need to specify the complete array element. Continuing our size, shape, and color example, you might have:
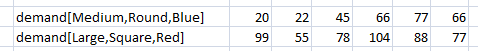
where demand is a graphical function over TIME. Again, you don't need to specify every element. Those not included will use the definitions laid out in the model.
To import values from a file into a conveyor or queue, enter all values for the conveyor or queue as a comma-separated list in a single cell of the import file. For conveyors, you specify one value per unit time in the conveyor. For queues, you specify one value per element in the queue.
The following example shows the format for specifying three values to import for a conveyor.
![]()
If you have variables that use special characters you may need to enclose the name in "". For example "R&D-Spending"[1].
Data exported from the model are in the same format as table output. If you're exporting using a table, the orientation of the data is the same as for the table. If you're exporting all variables, you can decide whether you want the variables to be listed as column headings or as row headings when you set up the export link.
When you export data, the contents of the export file are always erased before the export starts. Any text or formatting specified in the worksheet is lost when the export happens.
Use the Make Template option on the Import Data dialog box to create a file with the same format as described above. This allows you to adjust the exported values and use them as import values.
If your computer is set to use a , as the decimal separator, then all exported files will use this convention. If you select a csv format file, then ; will be used to separate entries. This will make the behavior consistent with Excel's. There's an option in the Preferences Dialog.
Imports from Excel will also use this convention. Imports from csv will try to determine if the data are , or ; separated, and applying this will allow you to import in the appropriate format. If the entries are ; separated, then arrays should also use the ; as a separator.
Import files created for legacy products that use the ... and *** continuation markers are supported, but should be changed to the new format. Incomplete continuations stop processing rather than replace the remaining array elements with the last value, as they did in legacy products.
Imports done on the interface (through the Import Data button action - see Button (Interface)) use the same file format discussed above, but with some restrictions.
When a model is published, only variables that are shown to the user are available for importing. Thus if you want to include a variable in an import file, it must be on a table or graph (or slider, knob...). You can create a table with all the variables you want available on the model layer to accomplish this.