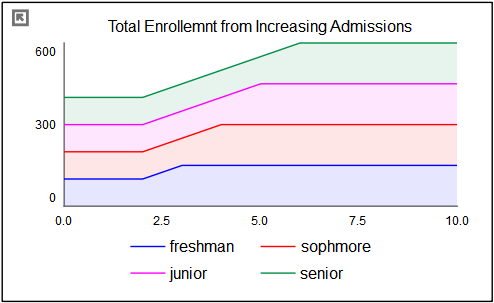
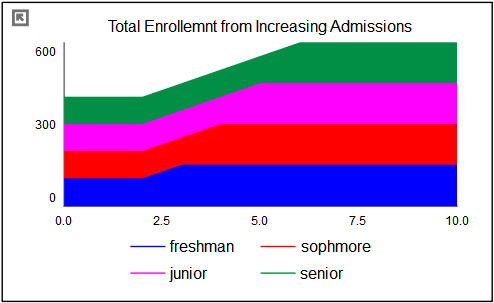
The area graph is a variation of the line graph, in which the location of each line is determined relative to the line below it, rather than the bottom of the axis. This is a very good way of showing the composition of a number of like things, such as population in different regions, sales at different stores, production of different crops, or students at a college.
Area graphs draw as a simulation progresses (or when scrubbing from the bottom toolbar).
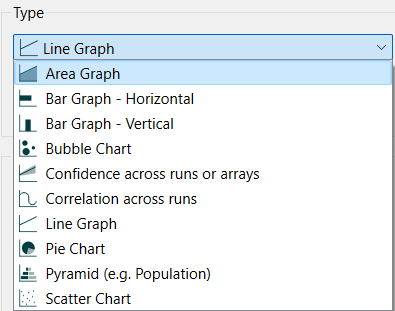
Select the graph ![]() from the Interface Build toolbar, and click on the page at the location you want it to appear (you can also add a page to an existing graph you've already put down). On the graph panel, select type Area at the top.
from the Interface Build toolbar, and click on the page at the location you want it to appear (you can also add a page to an existing graph you've already put down). On the graph panel, select type Area at the top.
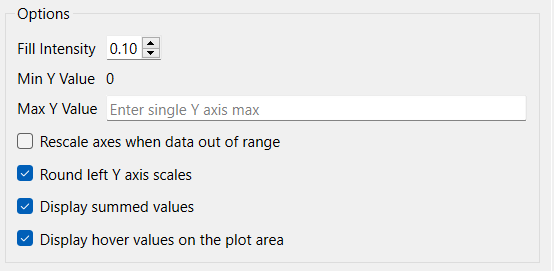
Fill Intensity determines the intensity of shading inside the regions of between the graph lines from 0 (no shading) to 1.0 (solid color the same as the dividing lines). Generally a small, but positive, number will work best here. See the notes below.
Min Y Value is the minimum value to use for the Y axis. This is always 0 for an area graph.
Max Y Value is the maximum value to use for the Y axis. Leave this empty to let the software choose a value.
Rescale axes when data out of range, if checked, will always show all available data. If this is not checked, and minimum or maximum values have been set for some variables the values may be truncated (their lines will not be drawn outside the specified range).
Round leftY axis scales, if checked, will round the values in the associated Y axis so that the scales are easier to read. If not checked no adjustment will be made.
Display summed values, if checked, will display the sum of the values when scrubbing. This sum will match the Y axis legend. If not checked the contribution of the variable to the sum will be shown. This will be smaller than the y axis legend except for the first variable.
Display hover values on plot area, if checked, will display the series value directly on the graph when scrubbing. If not checked, the value will appear only in the legend.
The series and display options as well as the styles for the area graph are the same as those for other graphs (see Graph Series Property Panel, Graph Settings Properties Panel, and Graph Styles Tab for more discussion).
The colors for the area graph will follow the color sequence set for the model (see Global Graph Styles Properties Panel), but you can specify the color used for each variable directly.
The area graph allows you to set the fill intensity between the different lines. The default, shown above, is 0.1 (10%), but you can select 0:
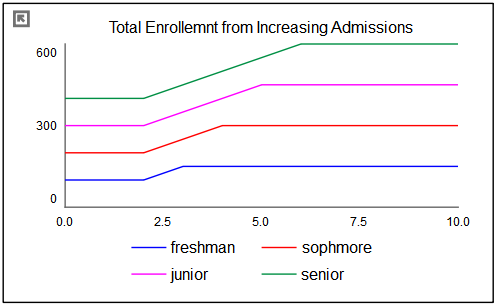
Or you can set it to 1.0:
to achieve different effects.