Use the display time object to both show the progress of a simulation, optimization or sensitivity run, and to allow users to view values at a different time on output devices.
To place a display time object, select  on the Interface Build toolbar(
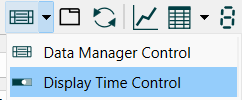 ), and click on the page where you want the display time object to appear. The object will appear as
  if there are no runs or
  if there are runs. During a run, the object displays progress
  and when paused it displays the current time relative to the end time
Display Time Options
You can specify colors and whether or not the user can scrub to different output times:
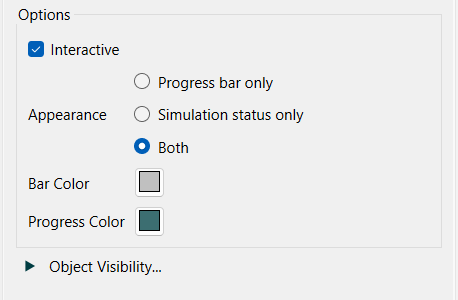
Interactive, if checked (and the progress bar is displayed), will allow the user to drag the control to see output values displayed from different times. It this is not checked the control simply displays the progress of the simulation.
Appearance lets you choose which content will be displayed.
Progress bar only to show just the time slider.
Simulation status only to show text such as "Time = 20" or "Run 11 Best payoff so far 32" depending on what is being done.
Both to display both of the above. The progress bar will be on the left and will resize based on the status text.
Bar Color is the color of the bar before the simulation has progressed to the value. At the beginning of the simulation to entire object is this color.
Progress Color is the color of the bar after the simulation has progressed to the value. At the end of the simulation the entire bar is this color.
Object Visibility
Determines whether the object is visible. See Object Visibility (Interface)