 at the bottom of the Properties Panel (or on the panel itself if you have undocked it).
The Loops Panel is available after you have simulated a model with the Loops that Matter option active. This option is set in the Model Settings Properties Panel. The panel will pop up the first time a model is run, and can be accessed anytime thereafter by clicking on the loops tab at the bottom of the Properties Panel (or on the panel itself if you have undocked it).
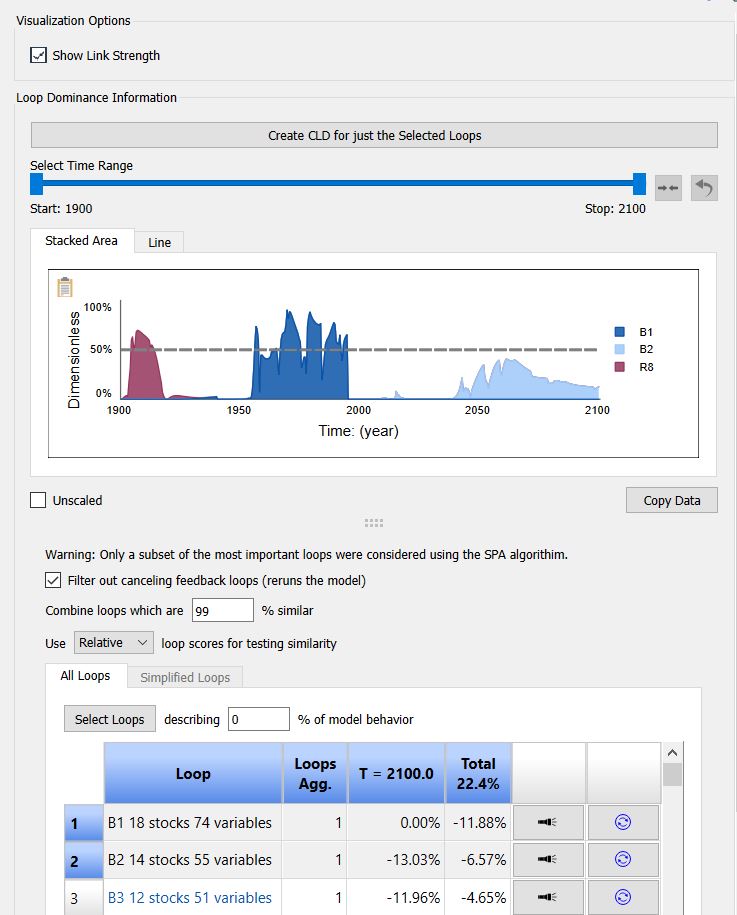
Show Loop Strength, if checked, will show the strength of links, and therefore loops, by using thicker lines for more important links (as measured at time T). The thickest lines are used for links which explain 100% of the behavior in the variable pointed to. Variables that do not explain changes are shown with the thinnest line. If this is not checked, the polarity of the links are show using colors (Red links are reinforcing (R/+). Blue links are balancing (B/-). Gray links are inactive. (Steel gray links are of unknown polarity (U)) but all have the same thickness.
Use this button to create causal loop diagrams that represent one or more specific loops of interest. Clicking on this will move to the CLD representation of the model as described in CLD Generation.
Note If the single selected loop is an aggregate loop, then the CLD will display all of the component loops comprising the selected loop. If more than one loop is selected only the loop show will be displayed in the CLD.
Select Time Range determines what time range is used for the determination of loop contribution and display in the graphs. It is the same control used in the Results Panel and the Causal Lens™ and the three are all connected so that changes here will change what is displayed in the other places.
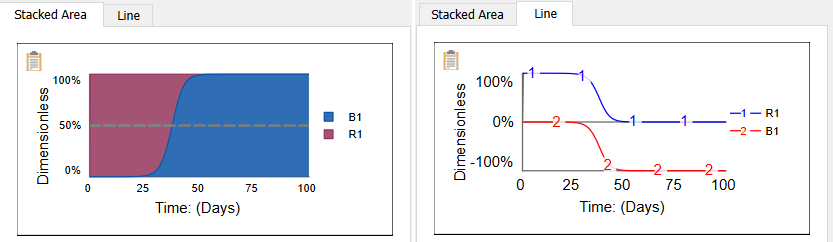
The Stacked Area and Line Graph displays the contribution of each selected loop to model behavior over time. Stacked Area displays the contributions of loops stacked on top of one another, with the balancing loops in shades of blue at the bottom and reinforcing loops in shades of red above them so that the total across all loops will add up to 100%. The Line Graph displays or as individual lines with balancing negative and reinforcing positive. Generally, the stacked area graph is easier to interpret, but the line graph can be helpful when comparing multiple loops with the same polarity.
You can add loops to the graph by clicking on them in the list, and remove them by clicking again. By default the first (most important) loop is shown in the graph. Clicking on more loops will explain more of the behavior:
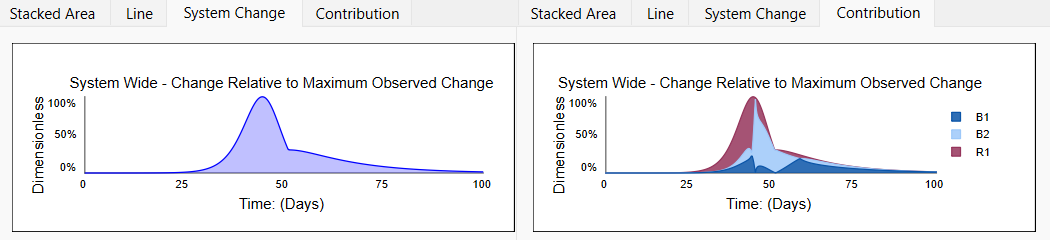
The System Change and Contribution graphs describe the total amount of change in behavior at each point in time, and the contributions of the different loops to this change respectively:
You can use the ![]() icon in the upper left to copy the displayed graph to the clipboard for use in other applications (or the Copy Data button below to copy the values).
icon in the upper left to copy the displayed graph to the clipboard for use in other applications (or the Copy Data button below to copy the values).
Unscaled, if checked, will display the graph without rounding the scales. This is most useful for line graphs.
Copy Data will copy the data shown in the graph as a set of numbers, with negative values for balancing loops and positive for reinforcing loops. The values are the same as shown in the line graph.
All loops were considered.../Warning only a subset...... is an informational message indicating whether it was necessary to selectively look for feedback loops as described in Loop Discovery.
Some models have two paths from one variable to another that simply cancel each other out. Such loops, when reported, are a nuisance because they show up with equal but opposite contributions to behavior making it more difficult to see the impact of other loops. By default such canceling loops are ignored, but you can uncheck this to see if there were any (there may not have been).
Note Toggling this checkbox will rerun the model as the information for canceling loops is discarded when loop strengths are computed.
This option allows you to consolidate loops that seem to have the same contribution to model behavior as discussed in Loops That MatterTM Overview. Set the correlation you want to use here as a %. Use 101 to prevent any loops from being consolidated.
This toggles between using correlations of the relative loop score (the one normally reported in Stella) and the absolute loop score in computing correlations. In general, because the absolute loop scores can be very large, they will be more highly correlated than the relative loop scores. More importantly, loop scores that tend to get vary large at similar time points (inflection points, equilibrium approaches), will be highly correlated.
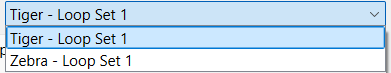
If a model contains two or more feedback loops that do not interact there will be a dropdown to select the set of loops to analyze. Feedback loops do not interact when there is no path both to and from one set of loops to another. If the loops are contained within a module, the loop sets will be given the name of the module. For example two separate animal population models might have:
This is a list of loops discovered in the model. The Simplified Loops tab is only available when viewing the simplified CLD as described in CLD Generation and noted below.
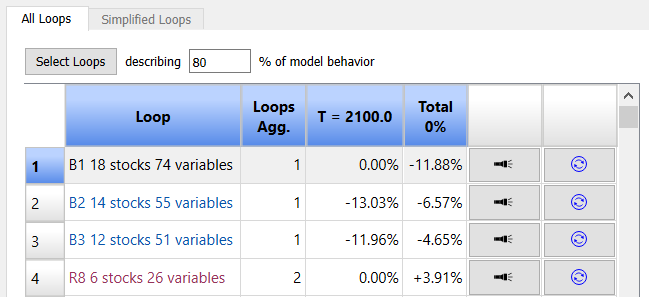
Select Loops provides a shorthand for selecting loops sequentially until at the specified % of model behavior has been described. Set the percent to a value (soch as 80)
Loop is the name of the loop. These labels are created automatically based on the ranking of the loops, but will use the name you supply for a loop score variable if you have created one. Each loop is also described by the number of stocks and total variables it contains. The default loop name is a polarity, index and indication of the number of stocks and variables involved in the loop. The polarity abbreviations are:
B - Balancing (negative feedback loop).
Bu - Mostly balancing but there is a reinforcing loop a small fraction of the time.
R - Reinforcing (positive feedback loop).
Ru - Mostly reinforcing, but the loop becomes balancing a small fraction of the time.
U - Unknown. The loop is sometimes balancing and sometimes reinforcing.
D - Dead. The loop was recognized as a loop but does not contribute to feedback. This happens when there is no time at which all links in the loop are active. Dead loops have a loop score of 0, but are included for completeness.
Note When viewing a simplified CLD the Bu, Ru and U polarities can result from loops that combine both a balancing and reinforcing loop in the original model.
Note Click on the loop name to add the loop to the graph above it (or remove it if it is in the graph).
Note Hover over the name of the loop to see all the variables involved in it.
T= 100 shows the loop score at the current time. You can change this time by dragging the end time of the progress bar in the Run Toolbar The values will add to 100% (in absolute value).
Total shows the contribution of loops to behavior over the time range being displayed. This is an average of the instantaneous values. These values again will add to 100%.
![]() highlights the loop on the model diagram.
highlights the loop on the model diagram.
![]() will add a loop score variable in the model for the selected loop. When you click on this, you will be placed in edit mode. Click on the place in the model diagram you want the variable to appear. Much like a summing converter, there will be no links into this variable. You can adjust the appearance of the variable from the Converters panel. After you have placed the variable you will be returned to the Loops Panel.
will add a loop score variable in the model for the selected loop. When you click on this, you will be placed in edit mode. Click on the place in the model diagram you want the variable to appear. Much like a summing converter, there will be no links into this variable. You can adjust the appearance of the variable from the Converters panel. After you have placed the variable you will be returned to the Loops Panel.
When you switch to viewing the CLD as described in CLD Generation there are some additions to the loops panel.
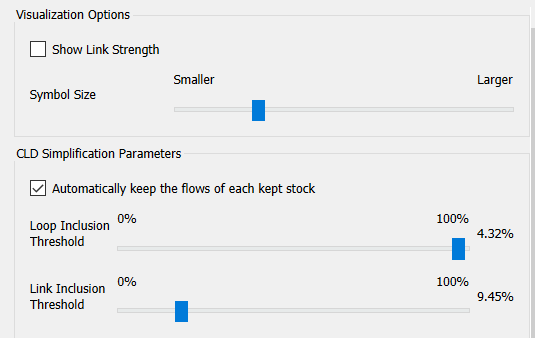
In addition to toggling Show Link Strength, it is also possible to adjust symbol sizes.
Symbol Size determines how big the symbols and labels are relative to the layout of the CLD. Make symbols large by dragging the slider to the right, smaller by dragging it to the left.
Use this to determine how much is displayed in the CLD. You can filter by variables, or by loops.
Automatically keep the flows... will always display the flow associated with any kept stock. This guarantees that the loops are physically interpretable, since stocks only change because of flows, and can be helpful for small models. For larger models unchecking this can help to reduce clutter.
Loop Inclusion Threshold determines how much behavior must be explained by a loop, before the loop will be included in the CLD. of A threshold of 0 means that every loop will be displayed, 100 means that no loops will be included because of this (unless there is only 1 loop). When this is set to 100 the link inclusion threshold becomes more important.
Link Inclusion Threshold determines how strong a link needs to be in order to be included. In this case the strength is measured by the amount of variation there is in he relative link score. This means that variables with only a single link coming in will not be included except when this is set to 0, or the variable is changing at some points in time and constant at others. This helps to focus attention on variables where the influence from other variables come together. Because some links may have a 100% variability, the maximum for this setting is actually slightly over 100%. Use the maximum to only add variables because of the loops they are involved in.
Not that both the threshold have a number of set points, since there are only a limited number of values where the diagram changes based on the various link and loop scores. This makes it much easier to find and get back to inclusion thresholds that you have used before, but it also means that the progression from 0 to 100% is not uniform.
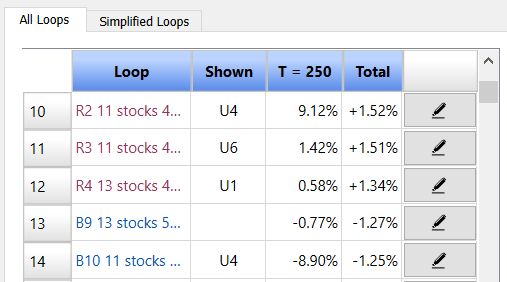
When viewing CLDs there list of loops will contain an indicator (Shown) of whether or not the original loop is included in the CLD,. If it is, this will give the simplified loop that the loop maps to, if not it will be blank. More than one of the original loops can map to the same simplified loop (Both R2 and B10 map to U4 in this example). In the case of B9, the loop is not represented at all in the simplified diagram.
The Simplified Loops tab presents the loops of the simplified diagram and shows how they relate to the original loops:
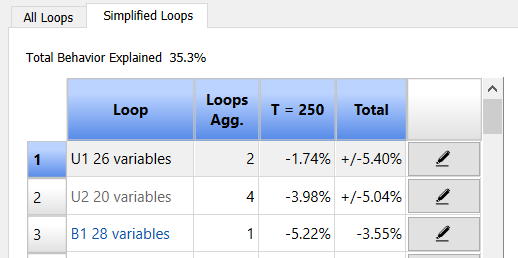
The Loops Agg. column indicates how many loops were combined to form a a loop in the simplified CLD. In this case U1 is formed by combining 2 of the original loops, and U2 by combining 4 of the original loops, while B1 is a loop in the original model. The first two are marked U because they combine reinforcing and balancing loops - a sign the diagram might be oversimplified.
When positive and negative loops are combined their loop score graph is split into the positive and negative parts:
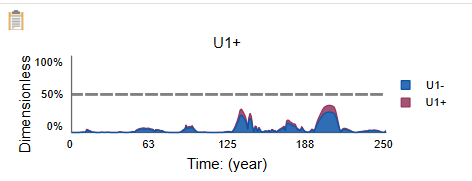
This is helpful in understanding how significant the opposing components are. In this case they are significant enough that the CLD should be recognized as an oversimplification.