JavaScript is disabled. Please enable Javascript for full website functionality. To learn how to enable Javascript visit http://www.enable-javascript.com/

The Connector - Spring 2020 Issue

SKIP Explores Early Childhood Education Challenges and Interventions Using Stella®

Saras Chung Saras Chung

Most taxpayers would vote an enthusiastic “Yes!” for a program that promises to yield a 13% return on investment. That’s what social scientists have estimated high-quality early childhood education programs return to their communities. By preparing young children for success in school, early childhood education positions them for higher levels of education, steadier employment, better housing, and better health. Why, then, don’t all young children have access to early childhood education programs?

Concerned citizens in St. Louis, Missouri asked this very question in 2017. Data showed that only 50% of St. Louis’ eligible 3- and 4 year-olds were enrolled in early childhood education programs of questionable quality, and citizens wanted to make sure that the city was providing equal access to all children. They brought their concern to Saras Chung, MSW, PhD, who was working as a computational social scientist at Washington University in St. Louis’ Social System Design Lab. The pro bono consulting she began led to a project proposal and, eventually, the establishment of SKIP, a strategy organization that co-designs systems change initiatives with communities.

“We realized that understanding and improving accessibility to programs wasn’t a project, it was a long-term process with many stakeholders,” says Chung. “We created SKIP to contribute to that process by serving as a design resource for the community and a way to make it easier for stakeholder groups to apply system dynamics.”

Chung and her team began by reaching out directly to people in the community. “We wanted to hear from families who weren’t accessing early childhood education programs, people who were disconnected from that system,” says Chung. Radical listening techniques that enable interviewers to strike up conversations with strangers were used to gather insights in the most impacted neighborhoods. The information collected led to the team’s first ‘aha’ moment.

“We started our inquiry wondering about barriers to enrollment in early childhood education programs,” says Chung. “Did parents, some of them eligible for government subsidies or free tuition, not know about benefits or maybe not care?”

In fact, parents cared very much about their kids' early childhood experiences. The radical listening effort uncovered that parents perceived program quality and safety to be questionable. “Parents had heard stories about kids just watching videos all day or being harshly punished,” says Chung. “Some of them had experienced abuse in their own early childhood program experiences. They reported being scared for their kids and sure that Grandma’s house would be safer.”

That insight on perceptions led to a fuller investigation of the early childhood education system. The SKIP team identified four interdependent feedback loops that drive early childhood education program accessibility and quality in St. Louis:

  • Accessibility for parents: The cost of early childhood education in St. Louis ranges from 10 to 15% of household income. Subsidies available to lower income families don’t cover full costs, and the lower the cost, the lower the quality. Even programs that are affordable and high quality may not meet families’ needs for hours of operation, location, or availability of seats.
  • Perception of Quality: Even when cost isn’t a factor, parents are leery of enrolling their child in a program that doesn’t have a good reputation. As worries about quality and safety hinder enrollment from bad word of mouth, programs find it difficult to stay open, which impacts accessibility.
  • Workforce quality and maintenance: The early childhood education workforce in St. Louis has a 30% annual turnover rate. Low wages and few opportunities for career advancement cause talented teachers to leave the profession, which impacts availability of seats and lowers actual and perceived quality.
  • Viability of the business model: It is expensive to deliver high quality early childhood education. Tuition has to cover costs for insurance, facility rent and maintenance, equipment and materials, food, administration and, of course, staff, where the number of teachers available to students is government mandated. In St. Louis, average tuition rates cover only 40% of high-quality program costs. Government subsidies cover only 32%. The inability to cover costs leads to across the board cutting including staff salaries, which impacts turnover, availability of seats, and real and perceived quality.
provider structure model 
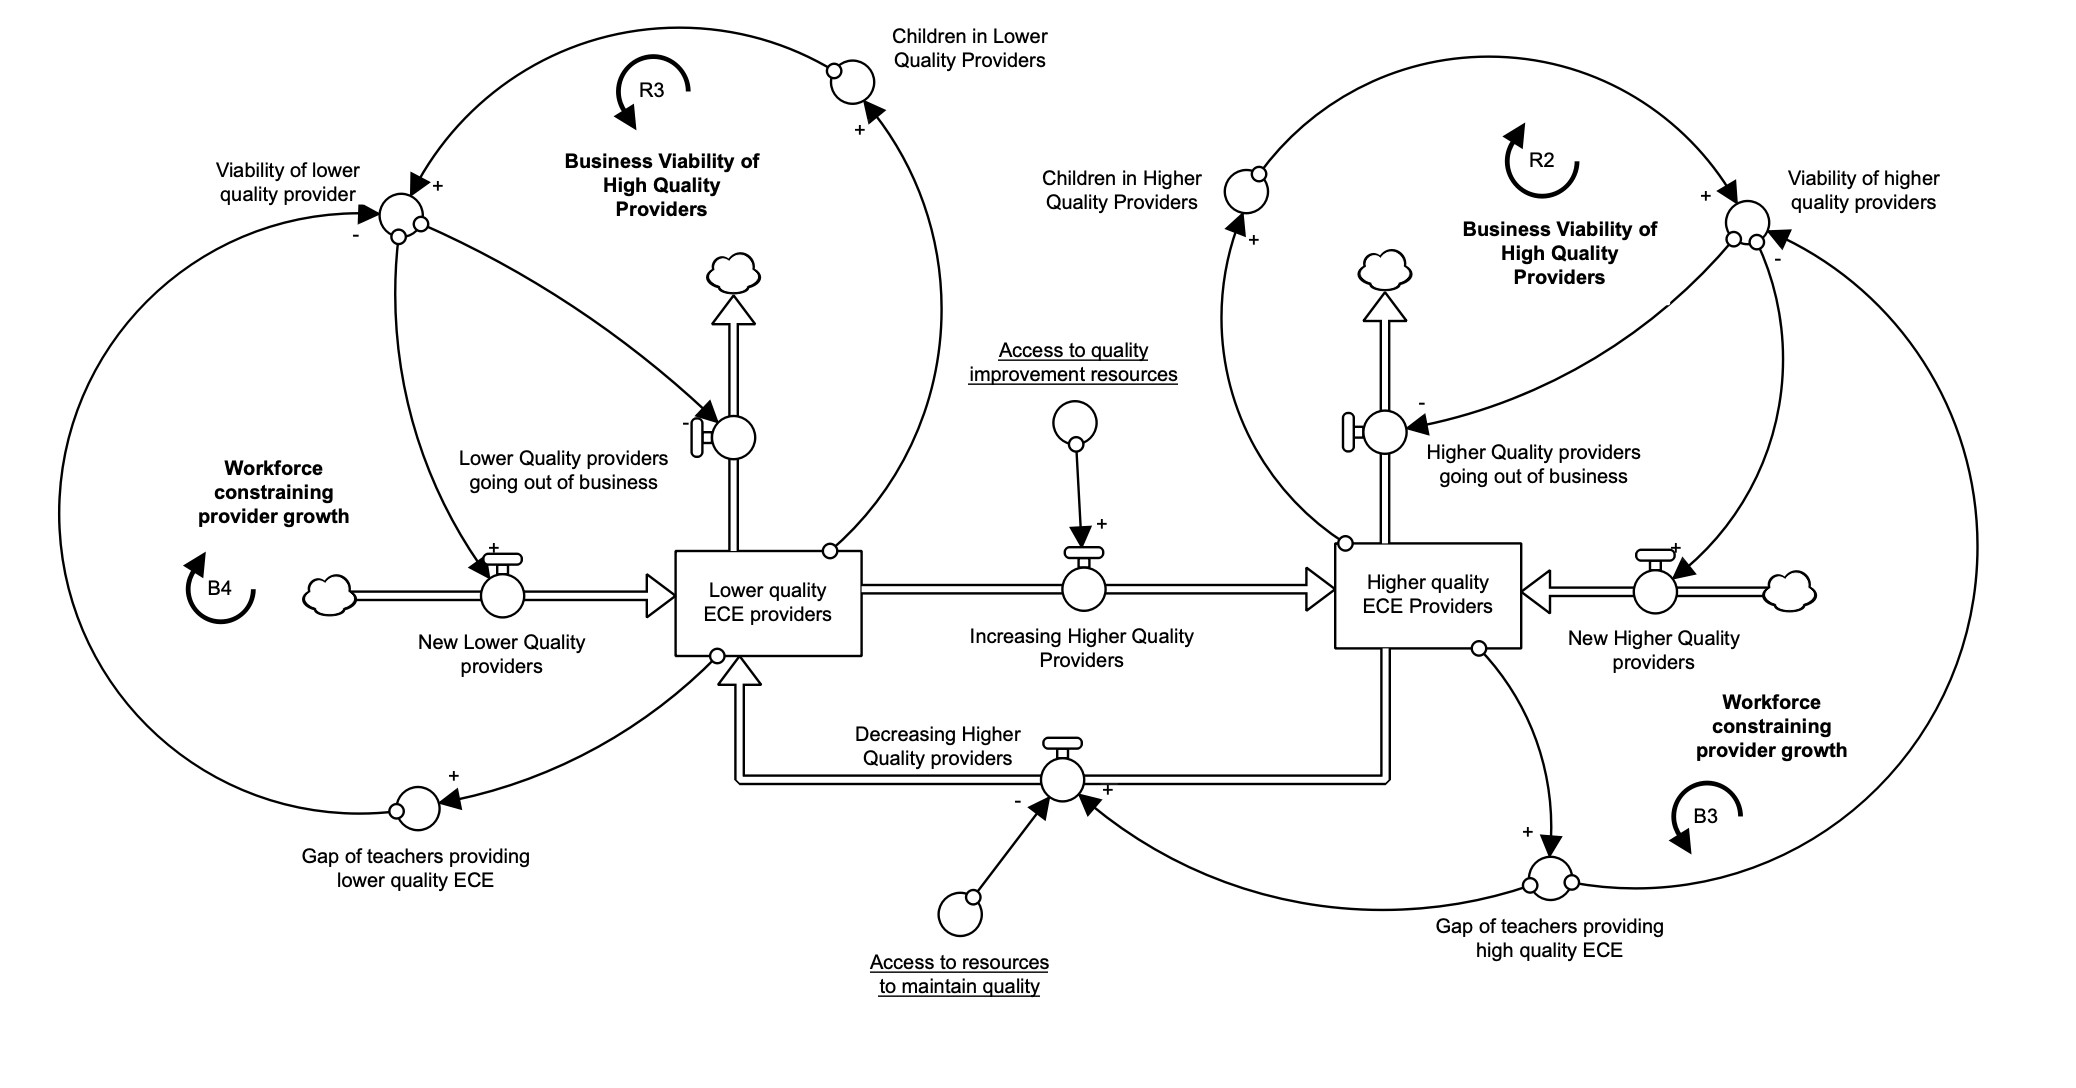
This “Provider Structure” models the dynamics between early childhood education provider business viability, workforce availability, and quality.

The connection of those feedback loops helped the research team see past a few assumptions. “We initially thought that the cost of programs seats was tied to availability, that fewer seats than required was inflating the cost of each seat,” said Chung. “Adding seats should solve that problem, but, using the model, we found that adding seats actually lowered program quality due to the inability to keep up with the workforce, which lowered perceptions of quality and use of the system.”

The model revealed the reason for that counterintuitive dynamic. To increase the number of early childhood education program seats available, St. Louis would have to hire more teachers. “Adding teachers should improve the system, but turnover is so high that adding teachers adds to an already challenging hiring situation and requires constant training for new employees,” said Chung. “Having a constant stream of less experienced teachers lowers quality, which then lowers perceptions of quality and thereby enrollment.”

Reducing turnover by increasing wages is also problematic. “While higher wages increase teacher retention, they increase costs, which are already too high for most families,” says Chung. “When one of St. Louis’ school districts instituted a pre-Kindergarten program, which is not mandated by the state, the wage and turnover problems went away. Unfortunately, the pre-K program pulled three- to five-year olds out of existing programs, leaving the younger children who require more expensive care.”

Obviously, finding good interventions for a complex system that isn’t working is very difficult. SKIP is working closely with two organizations that will lead the design and testing of interventions using the model. WEPOWER Tomorrow Builder Fellows works to activate Black and Latinx changemakers to reimagine and redesign systems that impact their communities, and the First Step to Equity Collaborative operates to create a region that makes children a top priority.

“For people experienced in system dynamics, model building is an effective way to learn a lot pretty rapidly,” says Chung. “The important thing is to build models that other people can use to test assumptions and design improvements. We used Stella Architect to create an interface that our partners who don't have system dynamics modeling skills can use for their work.”

To transfer insights and ownership of the model, SKIP is planning sessions to develop system insights with decisionmakers from the community using the Stella interface. “During the training, leaders will engage with the model to design interventions. Using interface dials, they’ll see, for example, that when teacher wages are raised, the costs are passed down to centers and inevitably parents, further restricting accessibility to the system. It’s important for people to test interventions they already had in mind using the model to see how their assumptions pan out. Often they’re surprised to see that cherished interventions weren’t as effective as they first thought.”

For the SKIP team, the power of their work lies in this transfer to community partners. “System dynamics is a way of thinking that can’t live and die with us,” says Chung. “We have to get other people, especially those with real-world expertise, involved.”

In addition to working with community decision-makers, SKIP’s website shares “voices” from community members in the form of quotes and videos, and clear descriptions of the four feedback loops. “The site is built for a relatively small audience: teachers, administrators, parents, policy makers and other stakeholders in the St. Louis early childhood education system,” says Chung. “We want them to see new perspectives and also say ‘Yes! This work does reflect the system we know.”

SKIP and its partners still have a long way to go to influence positive change in St. Louis’s early childhood education programs, but Chung can see a future beyond that work. “What we try in St. Louis might be useful in other cities and, since the model is comprehensive, we can broaden our work to the K-12 education system or go deeper into specific issue areas like compensation and charter/public school fragmentation.”

Whichever road SKIP takes, Stella will help them deliver models that can be used by their partners. “Building models is more intuitive and faster with Stella,” says Chung. “You save time developing complex formulas, and the software combs through code to find your mistakes. And, by making it easy to create intuitive interfaces, system dynamics novices can experiment with ideas and ask ‘What if?’ That’s what models are for. All of this is about learning and making systems change together.”

For more information, visit skipdesigned.com.

Managing Without Growth: Peter Victor Connects the Economy and Environment with Stella®

When we think about our economic future, we usually think about growth. What can we do to increase productivity, jobs, and wealth? We look at economic growth as a positive thing with few, if any, downsides. But how much can an economy grow? Is a growing economy always the best economy?

Published in 1972, Limits to Growth1 considered these questions by modelling the interactions between ecological and human systems. It remains a system dynamics classic and an inspiration for ongoing work, including the work of Peter Victor, PhD, Professor Emeritus, York University and Co-Investigator in the Centre for Understanding Sustainable Prosperity (CUSP).

“Limits to Growth was heavily criticized by economists when it was published,” says Victor. “For one thing, economists rely on prices when they think about economic futures. Generally, when a resource or good is scarce, prices will go up, and when there is a surplus, prices will go down. There are no prices, no money in the Limits to Growth model to moderate system behavior. I wanted to create a model that utilized more of the insights of economists and made my first attempt to do so 15 years ago using Stella.”

At the same time, Victor wanted to respect the views of ecologists who understand that the earth’s resources are limited. “As an ecological economist, I understand that the economy is embedded in the biosphere,” says Victor. “As economies grow, they make increasing demands on resources and generate increasing amounts of waste. We have to look at economic expansion as measured by gross domestic product (GDP) and ecological impacts together rather than two separate concerns on the government’s to-do list.” He developed these ideas in his book, Managing Without Growth. Slower by Design, not Disaster. “I wrote the book for academics and students, but it was published in 2008, just before the financial crisis when economic growth was a huge issue, so I received many requests for presentations.”

Victor’s work caught the attention of Tim Jackson, the director of CUSP. The two joined forces in 2010 to create ecological economic macroeconomic models. Their latest is LowGrow SFC, a stock-flow consistent macroeconomic model that combines economic, financial, environmental, and energy components. “Stock-flow consistency means that any money spent by one person or entity is received by another,” says Victor. “A financial asset for someone is a liability for someone else. Economies are stock-flow consistent and our models should be as well.”

Tim Jackson and Peter Victor Tim Jackson (left) and Peter Victor (right) collaborating on LowGrow SFC using Stella.

Designed around stocks and flows, Stella was the perfect modelling software for developing LowGrow SFC.” Long-term scenarios generated for Canada with LowGrow SFC are featured in the second edition of Victor’s book published in 2019.

“The work that Tim and I did on LowGrow SFC really benefitted from Stella,” says Victor. “We were able to collaborate in real time. And because we were drawing models and depicting stocks and flows rather than trading long paragraphs, we could actually see what the other person was thinking.”

LowGrow model overview Overview of LowGrow SFC 2nd edition components

Both the book and the model changed significantly between editions. Ten-year old data was refreshed and new data was added. “There was a mushrooming of literature in the area and we learned a lot about financial markets and realized that the financial sector had to be better represented,” says Victor.

LowGrow financial sector overview Overview of the financial sector structure of LowGrow SFC

Another big change in the model was a new green investment component. “Not all green investments, or money spent on environmental concerns, expand economic productivity,” says Victor. “A sea wall, for example, is built to prevent flooding not add to productive capacity. Other green investments, like more energy-efficient equipment, do add to economic productivity. Economies that add non-productive green investment in place of conventional brown investment won’t grow as fast but the green investments may well be justified by the environmental benefits they bring.” LowGrow SFC calculates the impact of both types of investment.

With those types of additions and based on Canadian and international data and government commitments and regulations, LowGrow SFC now combines:

  • Environmental and energy dimensions of economic activity
  • ‘Real economy’ components – production, consumption, employment, and public finances
  • The financial economy which includes interactions between financial agents

As a stock-flow consistent model, LowGrow SFC tracks the dynamics of expenditures among six sectors: households, non-financial firms, financial firms, the central bank, government, and the rest of the world. Those dynamics and economic impacts are modelled over a 50-year time frame.

“Like all such models, LowGrow SFC is used to increase understanding, not predict the future,” says Victor. “We can use it to create scenarios and test assumptions. For example, those who want to figure out how to get economies ‘back on track’ will discover why we can’t actually do that. The climate change crisis is upon us, if not already here, and we’re seeing the 6th extinction. Conditions are changing. We can’t go back.”

“Using the model, we can see there are better alternatives to going back to whatever we thought worked before,” says Victor. “For example, we can see that we can use excess capacity that is created through new, more efficient technology to give people more time off rather than expand output and increase environmental impacts. And, we can become more efficient without taking more from the environment. We can both manage the economy without growing it and have better lives.”

Economic growth is spurred, in large part, through individual consumption of goods. The idea that not all consumption is essential for good, productive human life is considered in a second, more personal model that Victor titled HappyGrow. HappyGrow models a two-person economy in which goods are purchased for some combination of use and status.

“HappyGrow helps us understand conspicuous consumption, buying things not because they are needed but because they increase the status of the buyer,” says Victor. “Most ads lure us with the idea that owning the product will make people admire us. Of course, if one person’s status goes up because they own a product, the status of the person without the product goes down. Using HappyGrow, we can understand the relationship between consumption, use, and status, and model the implications for well-being of commodities that offer different mixes of use and status.”

LowGrow SFC has caught the attention of policy analysts, researchers, and students around the world, and HappyGrow is available for anyone who wants a better understanding of consumption. Victor mentors Canadian and international PhD students and responds to requests for presentations. Through CUSP, he continues his relationship with Jackson and others who are eager to share ideas about and understanding of scenarios that feature healthy economies and environments.

To learn more about LowGrow SFC, click here or read “LowGrow SCF, A stock-flow consistent ecological macroeconomic model for Canada”. You can experiment with LowGrow SFC yourself on the isee Exchange here. To experiment with HappyGrow, click here.

1. Dennis Meadows, Donella Meadows, Jorgen Randers, William W. Behrens III, Limits to Growth, Falls Church, Virginia, Potomac Advocates, 1972.

Stella® 2.0 Has Been Released!

We are proud to announce version 2.0 of Stella Architect, Stella Professional, and Stella Designer; a new and innovative realm of system dynamics modeling.

The highlight of this release is the new Loops that Matter™ that allows you to immediately visualize the impact of every variable in a model on every other variable throughout the simulation.

Other exciting features include:

Automatic Diagram Layout: Creates stock and flow diagrams, or fills in missing pieces, for models created in other applications and opened in Stella.

A new Vensim® translator: Allows you to open your Vensim models in Stella and improve them using Stella’s advanced tools for creating professional, interactive interfaces and storytelling. This also means that now you can add more discrete objects or run multi-objective optimization on your Vensim models right in Stella.

A major renovation to the Equation Viewer: The equation viewer includes more detail about your model and can be displayed in a table, making it easier to read and navigate. It can be saved to a web page or copied to the clipboard in for pasting into a spreadsheet.

Highlighting Non-negativity Constraints: When a flow is forced to zero because of a non-negative stock or downstream conveyor/oven constraints, both the flow and the stock will now highlight to show that this has happened.

Vensim® is a registered trademark of Ventana Systems, Inc.

Loops That Matter™ Shows You What Matters in Your Model

Loops That Matter™ is a new feature in Stella Architect 2.0 that turbocharges your brainstorming by highlighting the most critical sections of your model. No more sifting through numbers to see how the components of your model interact—Loops That Matter lights up the most important feedback loops, giving you a simple visual guide to the forces behind their behavior. Use it to inform your choices as you build your model, test your model against your understanding, or deepen your knowledge of one you’ve already completed.

With Loops That Matter, you don’t need data to understand your model. Just run the software and let Loops That Matter show you the parts that matter!

Interview With Lead Developer Billy Schoenberg on Loops That Matter™

Billy Schoenberg Billy Schoenberg

What made you want to tackle Loops that Matter™ now?

For more than 10 years, I’ve said to myself that it can't really be that hard to analyze models. You have all the information and all the structure.  Well, that realization sparked an idea: In real time, I could calculate the percentage change in each dependent variable as each independent variable changed, independent of the change introduced by any other independent variable. There the idea sat for around 8 or 9 years…until I was leaving the 2017 ISDC.

I got stuck in the mother of all traffic jams on I-90 in Boston.  As I was sitting there, my mind floated back to my idea to determine, in real time as the simulation runs, the impact of each variable on each other variable.  I took my old “calculate the percent change idea” and developed that into what is now called the link score metric.  Using simple equations like c = a + b and c = a*b, I tested and developed the link score concept in my mind.  I called it responsibility – how responsible was the change in a for the change in c.

When I got home, I implemented the necessary logical operations to calculate the link score in a spreadsheet. I checked the results in the Bass diffusion model and things looked about right. I was getting metrics that made sense. I walked Bob Eberlein through my work and he said, "Billy, I have some good news and some bad news. The good news? This stuff is definitely unique. The bad news? Well, now you have to do a PhD."

What about the Visualization?

I had always been interested in the problem of visualizing structure-behavior relationships since reading the last chapter of Business Dynamics where Sterman talked about the tools of the future that would algorithmically show you the most important parts of your models and animate link strength and polarity over time. It became my goal to eventually build this type of model analysis support tool. When writing my PhD proposal, I allocated some of my time to develop my dream model visualization and analysis tool, ensuring that the results of my research are understandable and visualizable.

While developing visualization, I discovered two things:

  • There is a really simple heuristic at play that we all use when we make CLDs that we don’t even realize—it’s that we curve our connectors around the center of the smallest loop that the connector is a part of. This is what emphasizes the loops.
  • It’s not the strongest links you want, or the weakest links; you want the most variable links—the links which change the most over the course of the simulation. It was that discovery that became the basis of the Link Inclusion Threshold.

Why is this so exciting for you?

This has been a problem for so long in the field, and it's such an important issue.  How can we as a field be taken seriously when the only way to interpret and understand models is via reckoning, experience, and the art of model analysis.  Being able to actually objectively measure the importance of model structure seems like it ought to be step one in any model-based policy recommendation, but the fact of the matter is it's just not been possible for models of any reasonable size or complexity until the release of Stella® 2.0.  Once you pair that capability with the major advances we've made to machine generate human-readable, high-quality, algorithmically simplified CLDs, we've really changed the game in model teaching and understanding.

How We're Working Around COVID

In the continued effort to prevent the spread of COVID-19, our office will remain closed. We will continue working from home to offer our products and support our customers. You may not always reach someone immediately by telephone, but we will continue to check voicemails and respond as quickly as possible. For more immediate assistance, email and chat will be available during our office hours (Monday through Friday, 9 am to 5 pm ET).

COVID-19 Resources

As COVID-19 rapidly spread across the globe, we quickly looked to see how this pandemic could be modeled, and what models would be immediately beneficial to the public. This situation continues to change daily, and we hope the simulations and other materials we produced around COVID-19 help you to better understand this pandemic, its spread, and mitigating policies. Below are the simulations, webinars, and blog post we produced. We will continue to review these models as the pandemic progresses. Any comments or criticisms are welcome.

Simulations:
The COVID-19 Simulator
Modeling COVID-19 Effectively
COVID-19: Vertical Isolation in Brazil
Economic Impacts of COVID-19

Webinars:
Modeling the COVID-19 Pandemic: A Primer and Overview
Modeling COVID-19 Using Distinct Severity and Distributed Residence Times
Modeling Age-Specific COVID-19 Policies

Blog Post:
COVID-19: Modeling Distributions of Incubation and Recovery Times

Making Connections 2020

We were looking forward to seeing so many of you at our user conference this October, but the current pandemic made it very apparent that it must be postponed. We were blown away by all the positive interest and work many of you shared with us. The diversity of the work was amazing, and we can’t wait to be able to host the conference so you can showcase your work. We will be evaluating when it will be best to host our user conference in the future and look forward to seeing you there!

A Look to the Fall Semester

Like so many of you, we are continually adapting to the ever-changing pandemic situation. We know schools and universities are still considering whether it is safe to open for the upcoming fall semester. We are working closely with many universities to make sure their students and faculty can continue to access our software. We implemented the following policies for the spring semester, and we will continue to maintain them for universities that remain closed or partially closed for the fall semester.

  • Lab packs may be used on cloud-based services such as Citrix and AWS app stream or through remote desktops with a license server. If you have not already, you would need to put a license server in place to assure only the number of licenses owned are used concurrently.

or

  • If lab packs have active support contracts, customers can be set up with licenses to Stella Professional Online™ for the entire semester.

Please contact customer service if you have any questions or concerns on getting access for your students or faculty.

Beer Game

Beer Mug

The isee systems rendition of The Beer Game is now available online. Challenge your supply chain acumen with this classic game. Play the role of a beer retailer maintaining an inventory for a thirsty crowd. Over a 20-week period, you must manage your inventory against uncertain demands without running out of stock or ordering too much. After you’ve played through the game, you can review your results to determine how you did, how you can improve, and what knowledge you have gained. Once you have mastered the basic game, challenge yourself by fluctuating the order stream or competing against an automated retailer.

Single user and classroom licenses are now available. Visit here to learn more.

On the Road...Sort Of

While we may not be able to travel currently, we are keeping up with our many projects and conferences. Co-president Karim Chichakly has been able to continue his work with the Climate Interactive group that he started in the Fall. This is a two-year project and they were able to successfully have their workshop remotely in May. Karim is also working with the Global Think Tank Town Hall in an advisory capacity to T20 on "Best practices and policies for managing the public health crisis." T20 will then advise G20 and hopefully they will begin to act on the recommendations. Finally, Karim is also working with Bob Costanza on the “Integrated Farm Modelling to Improve Resilience” project. Currently in the proof of concept phase, this project aims to improve farm resilience, farm management, and economic decision-making in Australia and internationally. The expected outcome is a better understanding of the trade-offs between resilience and efficiency on farms, which would greatly benefit both farmers and banks.

Co-President Bob Eberlein has also been keeping busy. After building isee systems’ “COVID-19 Simulator,” he began working with the COVID-19 Healthcare Coalition, a private-sector-led response to this pandemic that strives to provide the real-time data to improve possible outcomes. Bob also led and worked on our exciting new version 2.0 to implement Loops That Matter™ with Lead Developer Billy Schoenberg. Bob, Billy, and web developer Claire Hornig have been recently working on building our virtual platform so we can all attend the International System Dynamics Conference (ISDC) online!

As always, we are excited to be attending the 38th annual ISDC virtually and will be set up to meet with you, answer your questions, and showcase Stella 2.0! This will be a new experience for all of us and we hope to talk to, and meet, many of you during this virtual ISDC.

Updates to Bibliography

Coming soon! Be on the lookout for the new peer-reviewed section on our Bibliography page. If you have work you would like included in this section, please send us the article citation and link so we can add it to our Bibliography.

Recent Posts

Fall 2019 Issue

A PhD student designs a plan to save water with Stella®, a credit union CEO collaborates with a system dynamics expert to better help his customers, Jon Darkow shares Stella tips and tricks, the 2020 isee user conference, new online courses, the next Barry Richmond Award, and isee systems heads to Australia...

Spring 2019 Issue

A former international development consultant uses Systems Thinking to analyze border security, a simulations expert tackles healthcare with Stella® Architect, Stella® Professional Online™ becomes the newest isee systems product, partners share their latest achievements, students present their modeling projects, new training and resources, and isee systems heads to Albuquerque...

Fall 2018 Issue

Public health organizations combat alcoholism with Stella, the Social System Design Lab applies system dynamics to community projects, the Cohort simulation helps managers and leaders learn to facilitate change, the 2018 Barry Richmond Scholarship Award winner is announced, new software and licensing features, the 38th annual Prouty, and isee systems heads to Iceland and Mexico…

Phone: (603) 448-4990 Email: info@iseesystems.com

   Monday - Friday: 9:00 am - 5:00 pm EDT | Saturday - Sunday: Closed
24 Hanover St, Ste 8A | Lebanon, NH 03766 | US

isee systems inc. holds trademarks registered in the U.S. Patent and Trademark Office for iThink®, Stella®, isee systems® and claims the following trademarks; isee NetSim™, isee Exchange™, Stella Live™, Causal Lens™, Stella Online™, Stella Professional Online™, and Assemblies™.

Terms of Use

© 2024. isee systems inc . All rights reserved.