Stella in Excel models can be created in Stella Enterprise from your existing XMILE models by selecting Publish for Excel from the Model Menu, . This will open a dialog allowing you to choose a file name and location. The saved model will have extension .sem (Stella in Excel Model).
If you want to use Stella's sensitivity or optimization capabilities in Excel you will need to set these up before publishing your model.
You can republish your model as often as needed.
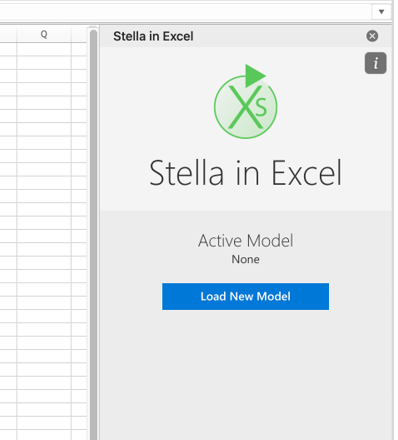
You will first need to install the Stella in Excel add-in for Excel which is available for free from the AppSource Office Add-in Store. Once installed, open Excel, open the Stella In Excel Task Pane, and then select the “Load New Model” button.
Browse to the location where you saved your .sem model and select it. Once selected, your model is loaded into your spreadsheet and you can begin to work with it.
Depending on your model, there may be more options on the task pane as discussed in Stella In Excel Task Pane.
Stella models in Excel open in Stella Live™, so that each time a change is made that affects the model results the model will be run again - recalculated in the language used to describe spreadsheet behavior. You can make changes to the assumptions used in a model through the functions ISEE.SETVALUE and ISEE.SETDATA.
Use built-in functions like ISEE.GETVALUE to get the value of variables at a given point in time, or ISEE.IMPORTDATA to set the value of variables within your model.
6. If you forget the exact name of the variables in your model when you’re trying to use ISEE.GETVALUE for instance, you can press the “Create Model Info Sheet” button to create a new worksheet in your workbook that lists out all of the variables in your model.
7. If there are any sensitivity analyses in your model you can run them by pressing “Run Sensitivity Analysis”. A new worksheet will be created with any output data from the sensitivity analysis and a PivotTable with results. The times reported by the analysis are those used in any ISEE.GETVALUE command. The variables reported by the analysis also come from those variables referenced in any ISEE.GETVALUE command.