Use the Stella In Excel task pane to load models, run sensitivity, optimize, and list model contents. The task pane is available once you have installed the Stella in Excel add-in. In the Home section click on Stella in Excel.
This will open the task pane:
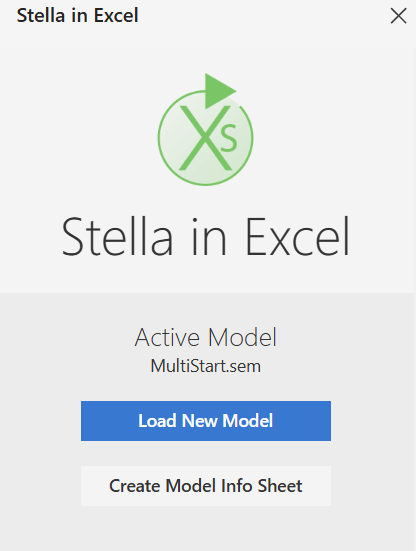
The task pane displays the model currently loaded, and then has a number of buttons to take action on this model.
This will load a model from an sem file, or replace the model you currently have loaded. Any references you have the set or get values from the model will remain valid as long as the referenced variable names are not changed. See the ISEE.GETVALUE, ISEE.SETDATA, and ISEE.SETVALUE
This will create a new tab in the current workbook called ModelInfo (or ModelInfo 1 and so on if there is already a tab with that name). The tab will contain information about the current model:
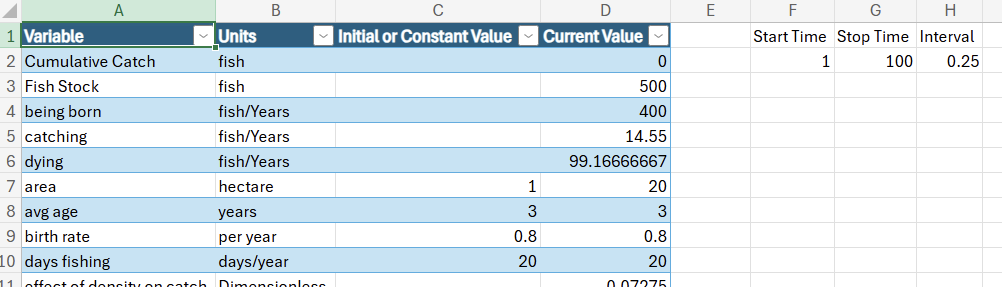
Variable is the name of every variable in the model. For large models you can use the dropdown to select only some names. If the model uses arrays each element will be listed.
Units is the units of measure associated with the variable. These are helpful in understanding what the numbers mean.
Initial or Constant Value is the number in the equation for the variable. If the equation is not a number this is blank.
Current Value is the value the variable takes on at the end of the simulation. This column uses the ISEE.GETVALUE function so that this information is updated as changes are made in the spreadsheet.
If you load a new model with different variables you will need to update the model info sheet.
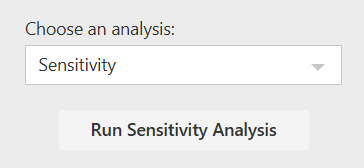
This option will only be available if you have configured your model to run sensitivity using the Sensitivity Specs Panel. The dropdown will appear if you have configured more than one analysis. Select the one you want to perform and click on Run Sensitivity Analysis.
Once you click on this, the sensitivity analysis you have set up will run. The results will appear as a pivot table in a new tab named SensitivityOutput (or SensitivityOutput 1... if that tab already exists). Use the filters in the pivot table to determine how you want to look at the data for analysis.
This option will only be available if you have configured your model to run optimizations using the Optimization Specs panel. The dropdown will appear if you have configured more than one optimization. Select the one you want to perform and click on Run Optimization.
The optimization will run, and the final run of the optimization will show in any place you have use ISEE.GETVALUE.