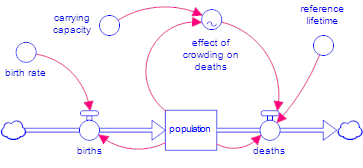
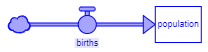
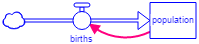
We'll start with a simple population model, with growth limited by carrying capacity. This model will let us demonstrate some of the basic principles of stocks and flows, and the importance of feedback in determining behavior.
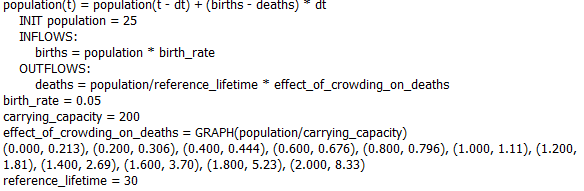
You can get this model from the isee Exchange, or build it yourself using the values above, or work through the Model Building Tutorial.
Open Stella Architect or Stella Designer
Download the starter model, or build it following the the Model Building Tutorial, and open it. If you are in the model window, go to the interface window (select Open Interface Window from the Window menu, or click on ![]() in the Mode toolbar).
in the Mode toolbar).
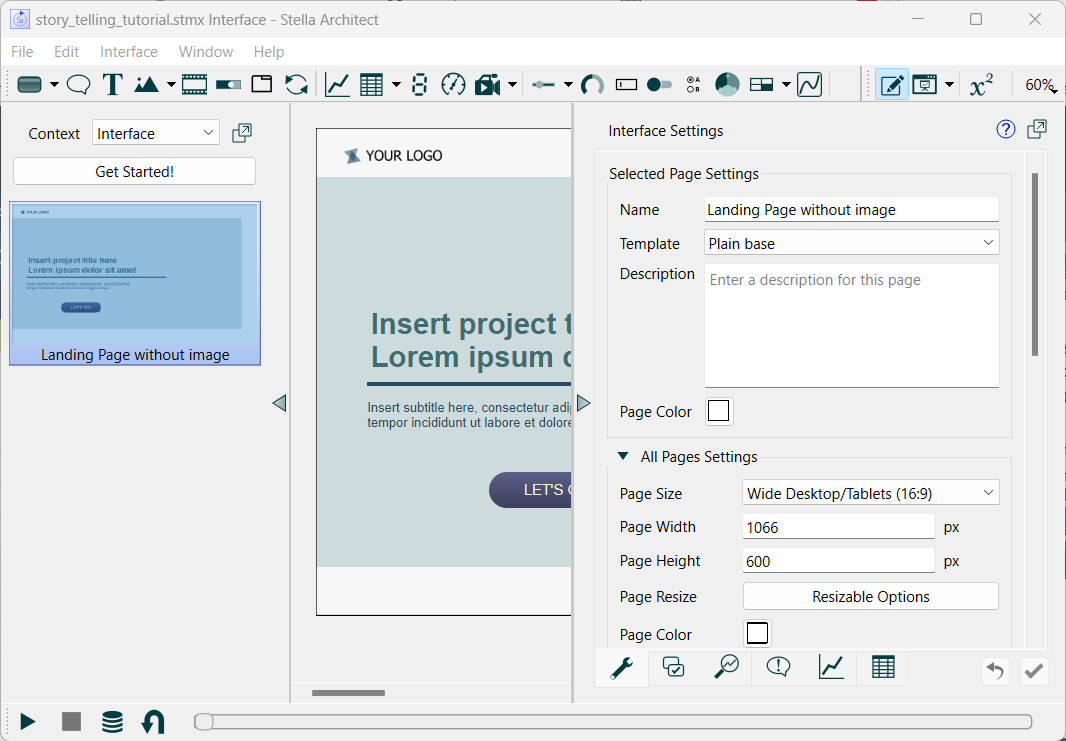
You should see the default landing page, with a thumbnail of the same showing on the left:
Plan out the Flow
Before you can begin working with your interface, you need to Plan out the flow. In this example, we'll open with a welcome page, then move to a tabbed selection between background, a model overview, and an experimentation page. The first two are informational, and the third interactive allowing the user to experiment with changing the birth rate, normal lifetime, and carrying capacity. We will also create a story showing how the different elements of model structure cause the observed behavior that launches from the second page. At the end of the story, we'll return them to the third page to continue experimenting. In total, we'll end up with four pages plus a story.
Load a Design
Click on the Get Started! button at the top of the Pages Panel (Interface) and select Basic Tabbed Blue from the dropdown at the upper left of the Design Selection Dialog. Use the “Copy Entire Design into Interface” option. This design (as described in Built in Designs) has a landing page (called Title Page) and then a Introduction, Exploration, Simulation, and Lessons page.
Customize the Landing Page
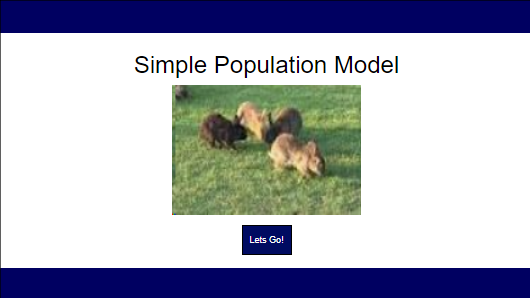
Click on Project Title, in the panel at the right you will see an edit box for the text "Project Title." Edit that to say "Simple Population Model." You can also double click on the title and edit it on the interface page itself.
Find an image that is more appropriate for a population model(png,jpeg, gif, svg, or bmp) and click on the rocks, then in the panel at the right click on Import from File and select your image. It is easiest if the image is in the same folder as the model, or a subfolder called Graphics (Distributing Models to Users). Your page should look something like this:
Remove the Lessons Page
We won't be using the Lessons page so click on it in the panel at the left and click on the  button at the top. If you accidentally remove the wrong page, select Undo from the Edit menu (or Ctrl+Z/⌘+Z) and try again.
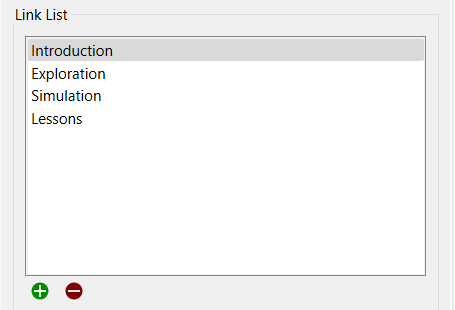
We will also need to adjust the Navigation Control (Interface) to only have 3 elements. Click on the Introduction Screen and double click on Lessons. At the right you will see 4 entries in the panel:
Click on Lessons and then click on the ![]() to delete it.
to delete it.
Note If you want to adjust the positions of the tabs it is easiest to select Template from the dropdown at the top of the pages panel at the left and make adjustments there.
Customize the Introduction Page
Double click on Project Title at the top and type in a new title such as "Population Dynamics."
Next add some text to describe the interface.
Click on the Text Box tool ![]() on the Interface Build toolbar at the top , and then click in the upper middle part of the page and type in some explanatory text such as "This model explores the way that carrying capacity impacts population growth and sustainable population." You can type directly into the text box you created, or in the "Text" area in the panel to the right, where you can see what you've typed in. You can change the font by using the styles tab
on the Interface Build toolbar at the top , and then click in the upper middle part of the page and type in some explanatory text such as "This model explores the way that carrying capacity impacts population growth and sustainable population." You can type directly into the text box you created, or in the "Text" area in the panel to the right, where you can see what you've typed in. You can change the font by using the styles tab ![]() at the bottom of the same panel on the right.
at the bottom of the same panel on the right.
Customize the Exploration Page
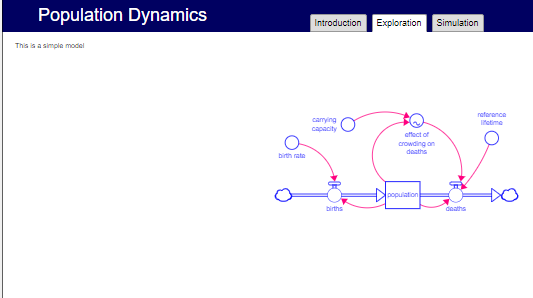
Switch to the Exploration page by clicking it on the left. Notice that the title on this page is already the title you typed in on the Introduction page. This is because the title is on a template and that template is used by this page (and the Simulation page).
There is a text box on the left with placeholder text, click on that to replace the placeholder text - something like "This is a very simple model."
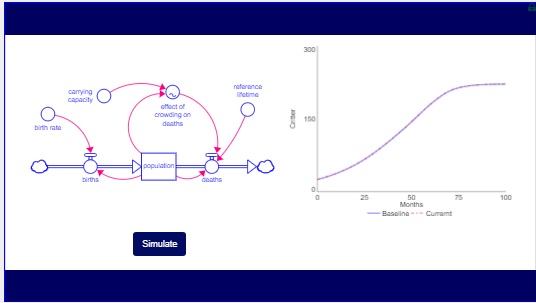
On the right you can see the model structure. If you click on that you can change the location of the structure and make other changes as noted in the Model View object description. You will probably want to zoom in (say to 150%) and adjust the position. Your page should look something like:
Set a Base Run
This could be done anytime, but will be needed when setting up the graph. Simply click on the ![]() button on the bottom left or select Run from the Model Menu (Ctrl+R/⌘+R will also work).
button on the bottom left or select Run from the Model Menu (Ctrl+R/⌘+R will also work).
Click on the ![]() at the bottom left to open the Data Manager then click on Run 1 and type Baseline. Click on the checkbox in the save column so that it is checked. Then click on Close to close the data manager.
at the bottom left to open the Data Manager then click on Run 1 and type Baseline. Click on the checkbox in the save column so that it is checked. Then click on Close to close the data manager.
Now Restore all Devices (![]() on the bottom, or the restore Actions (Interface) will leave this run alone while removing others.
on the bottom, or the restore Actions (Interface) will leave this run alone while removing others.
Double click on the page, or click on the ![]() icon on the top toolbar to return to edit mode.
icon on the top toolbar to return to edit mode.
Edit the Simulation Page
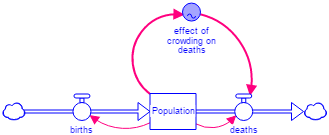
We want to let our users set the assumptions in the model and see the resulting behavior. There are four basic assumptions in this model: birth rate, average lifetime, carrying capacity, and the relationship between crowding and deaths (effect of crowding on deaths). The key result is Population, and we'll use the graph to show that.
Click on the Simulation page on the left to edit it. Again the title has already been changed.
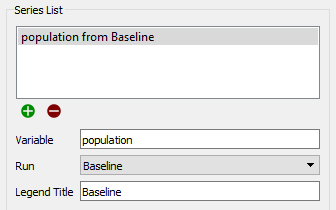
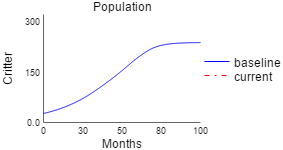
Click on the graph to select it. Use the ![]() button in the Series List section, and select Population in the dialog that appears. In the dropdown for Run, just below this, select Baseline (it will say Current Run by default). Below that, for the Legend Title, enter "Baseline". You should see something like this:
button in the Series List section, and select Population in the dialog that appears. In the dropdown for Run, just below this, select Baseline (it will say Current Run by default). Below that, for the Legend Title, enter "Baseline". You should see something like this:
Use the ![]() button and choose Population again, but this time leave the Run alone, and for the Legend Title type in "Current".
button and choose Population again, but this time leave the Run alone, and for the Legend Title type in "Current".
If you scroll down, lower in the panel, there's a place to enter the Title of your graph. Just type in "Population". Your graph should look like this:
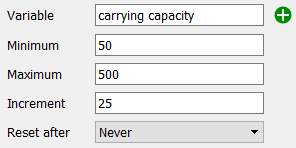
Click on the top Slider tool. The panel for the slider will open. Click on the ![]() icon at the right of Variable, and select carrying capacity. Give it a minimum of 50, a maximum of 500, and an increment of 25. The top of the panel should look like this:
icon at the right of Variable, and select carrying capacity. Give it a minimum of 50, a maximum of 500, and an increment of 25. The top of the panel should look like this:
Repeat that with the next two sliders: birth rate (minimum: 0; maximum: 0.1; increment: 0.01) and reference lifetime (minimum: 10; maximum: 100; increment: 5).
Click on the Graphical Input tool ![]() on the Interface Build toolbar, and put one below the sliders. In the panel, click on the
on the Interface Build toolbar, and put one below the sliders. In the panel, click on the ![]() icon and select "effect of crowding on deaths" from the find dialog (in this case, it'll be your only option available).
icon and select "effect of crowding on deaths" from the find dialog (in this case, it'll be your only option available).
Your page should look like this:
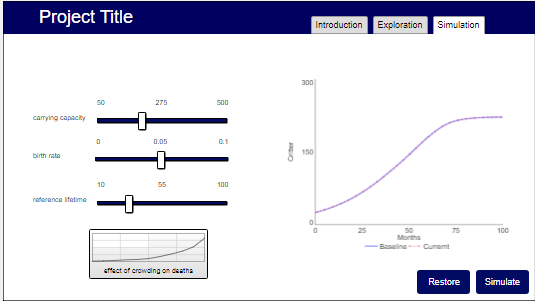
Click on Presentation Mode ![]() to see how this page behaves. Drag a slider (or click on the graphical input and change things from there), then click on Simulate to see the results. Use the Escape (Esc) key to get out of presentation mode.
to see how this page behaves. Drag a slider (or click on the graphical input and change things from there), then click on Simulate to see the results. Use the Escape (Esc) key to get out of presentation mode.
You can also click on the tabs at the top to move to different pages.
Your interface is complete - though we will come back to add a story.
Publish your interface
The interface you developed is now web ready. To publish it, select Publish from the File menu. A new window, which is actually a simple web browser, will open and ask you to sign in:
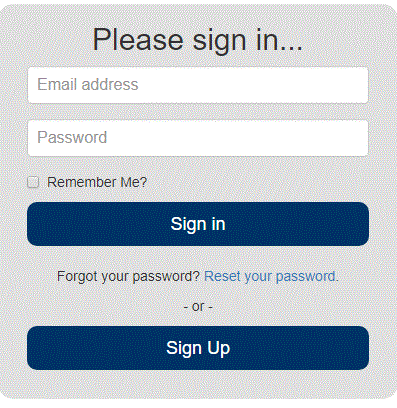
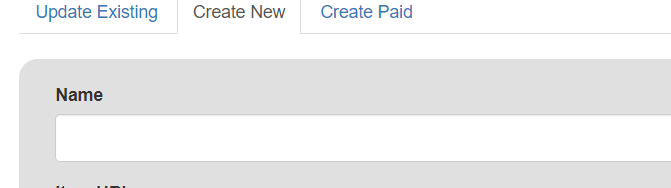
If you haven't created an account on the isee exchange yet, do that now - it's free and easy (see Publishing to the isee Exchange). Then, once you're logged in, you can create a new Sim App by clicking on the Create New tab
Give it a name, accept the terms and click on Upload. Anyone with a (modern) web browser can then work with the interface you've published.
Stories are ways of showing how structure and behavior relate to one another. Usually, the story is a simplified version of a dashboard that shows the consequences of adding structure. That is what we will do here.
Add a Story
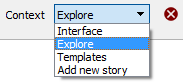
We want to be able to navigate from the Simulation page to the story, but we first need to create a story. Click on the"Add new Story" in the context dropdown in the panel on the left (or select Add Story from the Interface menu). The Create Story dialog will open:
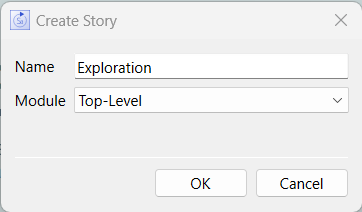
Stories, like pages, can be named, so type in "Exploration" as the name of our story. Our model only has a single module, so only Top-Level is available from the dropdown for this story. When you click OK, you will be asked to select a template from one of the designs:
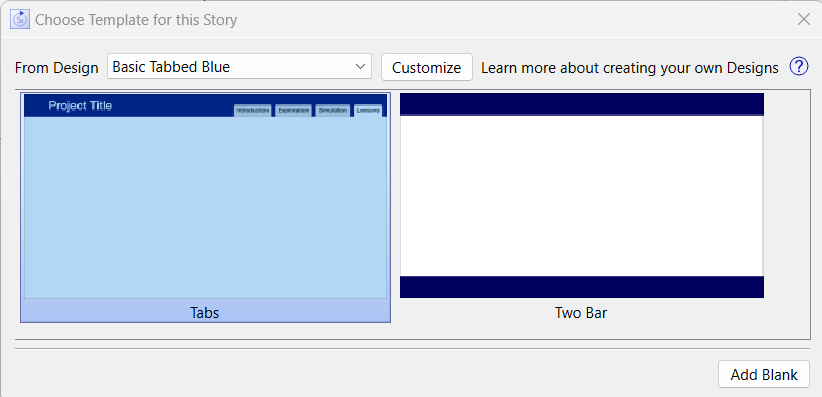
The template helps to provide visual and functional consistency. In this case select Two Bar, since we don't want the Tab controls in the story.
Next, the setup visibility dialog will open:
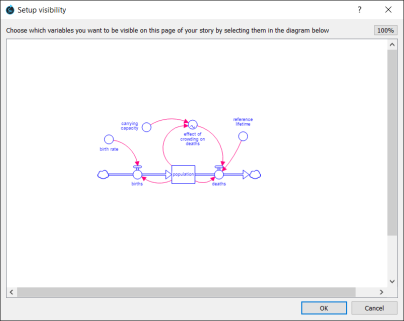
Stories are built around model structure, and part of that structure is displayed, effectively as the background, on each page of a story. As the story progresses, more structure is revealed till, at the end, everything is showing.
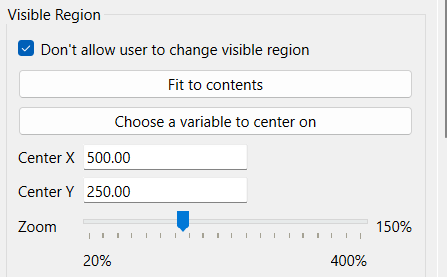
To be sure we can fit everything nicely on the page, we organize the layout for the last page of the story first. Drag over the entire structure (everything should highlight), and click on OK. In the panel at the right, change the Zoom to be 150% (if you don't see a zoom slider click on View Story Settings at the top of the panel). Change the x,y position to 500,250; you should see the diagram move up on the screen.
Return to the Simulate Interface Page by clicking on Interface in the dropdown at the top of the panel on the left (click on the page named Simulation if it is not already selected). Click on the graph then shift click on the simulate button to select both. Then copy them (Ctrl+c or Edit>Copy or right click copy).
Go back to the story by clicking on Exploration in the dropdown at the top of the panel. Past the graph and button (Ctrl+V or Edit>Paste or right click Paste). Rearrange them so that they look okay. You should have something like:
With all our geometry set, we can build the story knowing that we'll have enough room at the end of it.
Double click on the diagram to open the model display settings. You can also single click (then click on the ![]() button in the middle on the right if the panel is not open) and click on the Edit Story Items button on the panel.
button in the middle on the right if the panel is not open) and click on the Edit Story Items button on the panel.
Click on the Change visible structure button, and drag to select everything. This time it should all switch from highlighted to not highlighted.
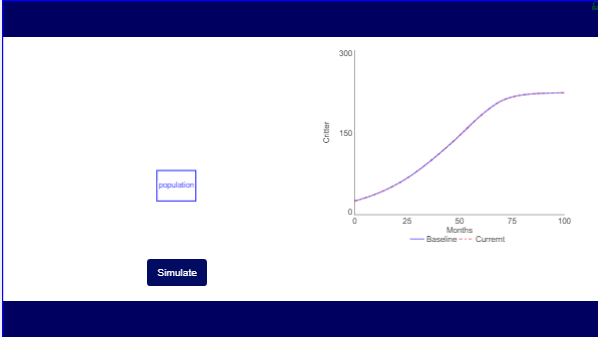
For the first page of the story, we want only the "Population" stock, so click on that, then click OK. You'll get a story page with only Population visible.
We'll come back to finish the story below, but first we move some content to the template.
Move the Graph and Button to the Template
As the user goes through the story, it's helpful if some things remain in the same position on each page. You can accomplish this by copying and pasting the objects you want to reuse, but using templates provides a more flexible solution.
Select the Simulate button and the graph, and then select Cut from the Edit menu (or use the keyboard shortcut of Ctrl+X [Windows] or ⌘+X [Mac]).
In the dropdown at the top of the Pages Panel (Interface), select Templates.
You'll see an template called Exploration_Template. This is the template for this story (the other templates are for the interface pages). Click on that template.
Note If you did not use Exploration as the name of the story when you created the story the template might be called Story 1_Template. The name does not matter.
Select Paste from the Edit menu (or use the keyboard shortcut of Ctrl+V [Windows] or ⌘+V [Mac]). The button and graph should show up in the same position they were in on the story page. (Don't use the right click menu here as it will change position).
Return to your story using the dropdown at the top of the Pages panel. The page will appear the same as it did before - but now the graph and button are on the template page.
Add remaining story pages
Return to the story you started creating by selecting it from the Context dropdown  at the top of the list of pages. As we add pages to the story, we'll reveal more of the model structure. On page 1, you should see (as shown above):

Now, add a new page to the story using the Add Page button at the top of the left-hand panel, or by using the Interface menu. The setup visibility dialog will open. Click on "births", and click OK.
Add a third page, adding in the connector from Population to births. Your latest page should look like:
Add another page, and this time add in "deaths" and the connector from Population to deaths. This page should look like:

Add another page, and add "effect of crowding on deaths", as well as the link from Population to it, and the link from it to death. This page should look like:
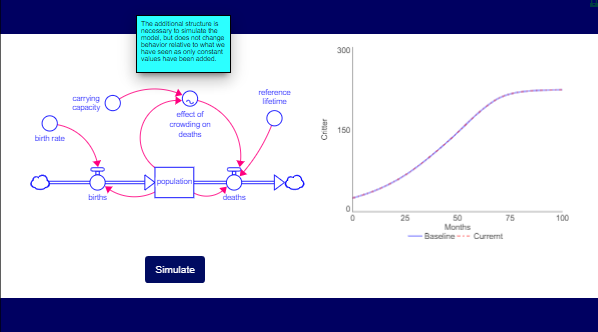
Finally, we'll add everything left on the diagram (except the text box, if there is one). To do this a new page, then click and drag your mouse across the model. This will select (and highlight) the whole structure. Click OK. Go to the panel on the right and click the button marked "Highlight structure". Drag your selection over the entire structure, removing the highlight from everything. You will probably need to do this twice as drag selecting like this toggles highlights if everything is already highlighted, but otherwise it will highlight everything selected.
There will be a total of 5 Story pages.
Add Control and Annotation to the Last Story Page
Click on the Annotation Button ![]() in the Interface Build toolbar, then click above the stock and flow diagram (or in another place, if you put the graph there). Double-click on the annotation and type in whatever text you want. Right now, we'll put in some text explaining the final step (see below). Then, click on the Style tab
in the Interface Build toolbar, then click above the stock and flow diagram (or in another place, if you put the graph there). Double-click on the annotation and type in whatever text you want. Right now, we'll put in some text explaining the final step (see below). Then, click on the Style tab ![]() of the panel, and select a color you like for the annotation's background. Your page should look something like this:
of the panel, and select a color you like for the annotation's background. Your page should look something like this:
Add annotations to all the pages
For each of the other pages, add an annotation and move it closer to the structure being revealed. The suggested annotations, in sequence, are:
Set up navigation back to the Simulate Page
On the last page of the Story, add a button to navigate back to the Simulation page. You can either add a new button using the Button tool ![]() on the top toolbar, or go to the interface and copy one of the buttons there then paste it. Copying will make the styles match. (We can't copy the Simulate button visible on the page because it is on the Template, not the page).
on the top toolbar, or go to the interface and copy one of the buttons there then paste it. Copying will make the styles match. (We can't copy the Simulate button visible on the page because it is on the Template, not the page).
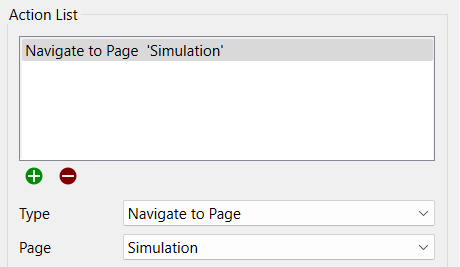
Change the action on this button to be Navigate to Page, and select Simulation as the page to navigate to:
Set up Navigation to the Story
Click on the Go to Interface ![]() button in the toolbar (or select Go to Interface from the Interface menu). Then, click on the Simulation page in the list of pages on the left.
button in the toolbar (or select Go to Interface from the Interface menu). Then, click on the Simulation page in the list of pages on the left.
Make a copy of the Restore button by right clicking and selecting copy. Then paste the button by right clicking and selecting paste. This will keep the button style the same. Rename the button to Story.
Click on the ![]() beneath the action list then select the action Navigate to Story. Since there is only 1 story, and we want to start at the first page, you don't need to change anything else.
beneath the action list then select the action Navigate to Story. Since there is only 1 story, and we want to start at the first page, you don't need to change anything else.
Republish
Publication is exactly the same as it was previously. Just use Update for your already published Simullation Application.
On the Interface Settings Properties Panel at the right click under All Pages Settings (you may need to click ![]() to see the options) click on "Start with Stella Live Active." Once you do this the model will be simulated each time a change is made. Thus, you can remove the Simulate buttons from the Simulation page and the Exploration Template.
to see the options) click on "Start with Stella Live Active." Once you do this the model will be simulated each time a change is made. Thus, you can remove the Simulate buttons from the Simulation page and the Exploration Template.
Try it - it's cool.