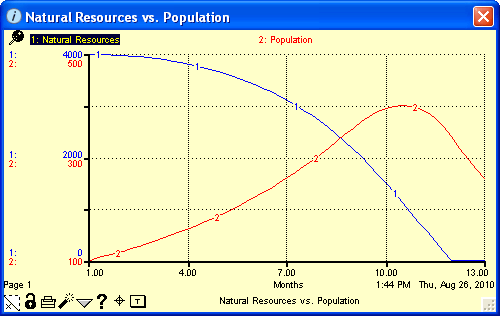
The Graph Pad window displays the graph pad. For information about defining graph pads, see Graph pads. For more information about pads, see Working with pads.

 /
/ 
Click the pin to pin or unpin the graph pad from the layer. Pinning a pad to a diagram layer makes the pad visible whenever you are viewing the layer on which it's pinned. For more information, see To pin or unpin a pad .
Note: If the pin appears grayed out ( ), the pad is actually on a different layer than the one you are currently viewing. You can only pin the pad to the layer on which it was added.
The names of the plotted entities appear at the top of the graph.
If you defined the graph as a comparative graph for a single entity, the sequential identification number for each run appears next to the entity's name, each in a separate color, which corresponds to the color of the curve for that run.

Scale information for the graphed entities appears along the Y-axis of the graph.
The identification number for each entity appears to the far left, in the same color that is assigned to the entity and its curve. The entity's scale values (from maximum to minimum, top to bottom) appear along the Y-axis, also in the corresponding color.
If a single scale is selected for multiple entities, a bracket appears next to the entity numbers and the scale values appear in black (as shown for entities 3 and 4, below). For more information about setting (and removing) scales, see To set the scale for entities in the graph.

 /
/ 
The page number for the currently displayed page appears above the page turner in the pad's lower-left corner. If the pad contains more than one page, use the page turner to move between pages. If the pad has only one page, an "x" appears in the page turner. For more information, see To turn the page in a pad.
 /
/ 
Click  to lock the current graph values. When values are locked, they will not be overwritten during subsequent simulation runs until they are unlocked.
To unlock the graph's values, click  .
.

Click  to print one or more pages in the graph pad.

Click  to clear the currently displayed graph values.
Note: The dynamite button is not available if the graph values are locked.

Note: The navigation arrow appears only when you have selected an entity name at the top of the Graph Pad window.
Click  to navigate to the selected model entity on the Map or Model layer.

Use the  button to add, view, or edit documentation for the currently displayed page.
Note: You can also add a note to one or more specific points on a curve in the graph. For more information, see Event Annotation, below.
 .
.Note: If you have defined a comparative graph and have generated output using the software's sensitivity analysis feature, clicking the  button opens a journal of the most recent sensitivity setup in the Sensitivity Setup window. For more information about using sensitive analysis, see Performing sensitivity analysis.

Note: The event annotation feature is available only when you have selected an entity name at the top of the graph pad.
Use the event annotation feature to provide documentation for any point on plotted curve. This feature allows you to mark one or more notable points on the curve so that you can point out things such as shifts in feedback loop dominance or other important dynamics. For more information, see Graph pads.
Note: Adding an annotation to one or more points in a curve automatically locks the graph. This preserves the integrity of the graph and associated points by preventing a new simulation run from changing the graphed curve. Unlocking the graph (by clicking  ) deletes the annotations.

Note: The logic tracing feature is available only when you have selected an entity name at the top of the graph pad.
Use the logic tracing feature to sequentially traverse the through the inputs to a model entity in the graph. Logic tracing from a graph is available only for graph pads that have been created on the Interface layer. For more information, see To perform logic tracing from a graph.
The title of the currently displayed graph (as specified in the Define Graph dialog box) appears centered at the bottom of the graph pad.
The displayed page's title also appears in the window's title bar
Displays the date and time that the graph was created, or the date and time of the last simulation run.