 ) and then click on the location you want it to appear. You can drag its location or change its size using the control handles.
The Data Manager Control allows interface users to control what is displayed in comparative graphs and tables and also use the settings from earlier runs in new runs.
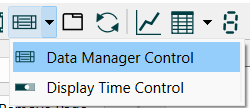
To place a Data Manager Control ![]() on the interface select it from the toolbar () and then click on the location you want it to appear. You can drag its location or change its size using the control handles.
on the interface select it from the toolbar () and then click on the location you want it to appear. You can drag its location or change its size using the control handles.
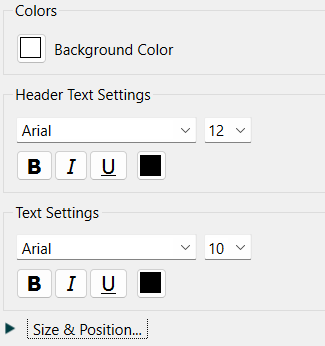
Background Color is the color that will be displayed behind the text of the control. Click on the current color to choose a new one.
Header Text Settings determine the appearance of the text in the top row of the control.
Text Settings determine the appearance of the text in the remaining rows of the control.
Size & Position allow you specify location based on coordinates rather than by moving it directly.
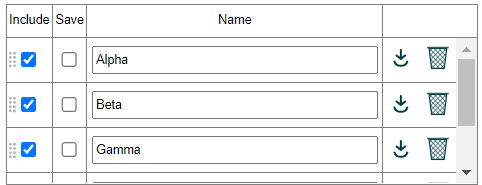
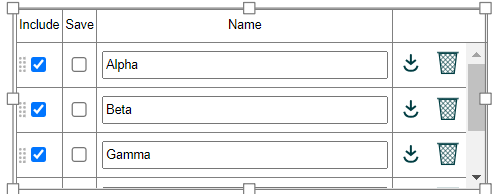
The use of the control is generally intuitive. Runs are displayed in the order they show up in the control, with the last (most recent normally) run marked include being shown in non-comparative tables and graphs. To change the order of runs use the ![]() mark next to the Include checkbox to move runs up or down in the list.
mark next to the Include checkbox to move runs up or down in the list.
Include, if checked, means the runs will be included in comparative graphs and tables. The first included run will display on non comparative graphs and tables and other output objects.
Save, if checked, will prevent the run from being deleted on a restore of outputs or restore all devices.
Name is the name of the run. Type in a new name to change it. Names must be unique so if you type in a duplicate name it will not be changed.
![]() will use the parameters from this run in the next run. If Stella Live is active the model will simulate again with the parameters from this run.
will use the parameters from this run in the next run. If Stella Live is active the model will simulate again with the parameters from this run.
![]() will delete a run. If the run is marked save the user will be asked to confirm deletion.
will delete a run. If the run is marked save the user will be asked to confirm deletion.