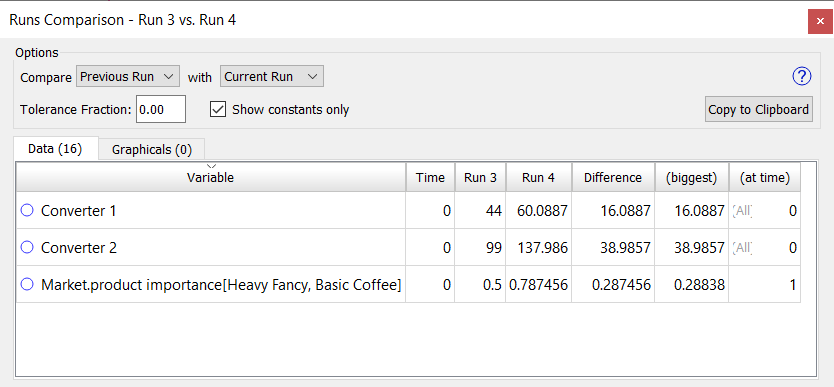
The Runs Comparison window is used to compare two runs looking for any changes in the values of variables. It compares both constants and graphicals and, optionally, all model variables. It is opened from the Window Menu on the model and will provide results only if at least two runs have been made.
When the window opens it will, by default, show a comparison of the two most recent runs made. If there are not two runs, it will not display any results.
Comparison is made between 2 runs. Select the first run in the first dropdown and the second run in the second dropdown. The first dropdown contains a list of all runs, along with Previous Run which is the second to last run that was made. The second dropdown contains a list of all runs, along with Current Run which is the last run made. When you select a run, the comparison will be made.
If you select either Previous or Current, then each time the model is run the contents of the Runs Comparison window will be updated. If you select specific runs, then making additional runs may cause the run being compared to drop out of available runs (see Data Manager). If this will happen you will see a warning icon  letting you know the comparison will be lost and giving you an option to mark the run as saved.
This is the smallest difference that will be reported. It is a relative tolerance so that the difference must be bigger than the value in the first run multiplied by this before they are reported. Enter a number between 0 and 1.
Checking this will restrict the output to model constants. This is very useful in quickly finding what parametric changes were made between two runs.
This copies the contents displayed to the clipboard. The results will be a tab delimited set of values that should paste well into a spreadsheet. If you are working on the graphicals tab, the x,y pairs are put in separate columns and extra padding is added to the labeling.
The runs comparison is made whenever the window is open. If you change the runs to be compared, or run the model with one of the special runs selected, a new comparison will be made and the results displayed.
If you are comparing a run to itself, or if the run you were comparing to is deleted, there will be no differences between the runs.
If you compare two runs with different run specifications (different start time, stop time or save interval) you will see a message:
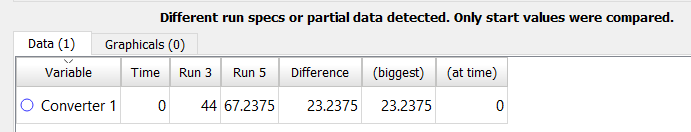
In this case the values at the beginning of each run will be compared and the time columns will either display the start time for the runs or be blank if the start times are not the same.
If the two runs you are comparing have no differences, there will be a message:
This tab displays differences found in the model results (n is the number of differences). By default the differences will be sorted alphabetically by Variable, but you can sort on any of the columns described below by clicking on the column header.
Note During Stella Live the contents will empty if you are including the current run. They will refill when you leave explore mode, or if you reselect the current run.
Variable is the name of the variable that has different results. If the variable is arrayed the specific array element will be noted. Click on the name to open the Results Panel on this variable.
Time is the time at which the first difference was observed.
First run name (Run 1) shows the value of the variable in the first run at the noted time.
Second run name (Run 2) shows the value of the variable in the second run at the noted time.
Difference is the difference between the first and second run values. If you sort on this column it will sort by the absolute value of this number.
(biggest) is the largest difference that was found. For constants, this will be the same as the difference, otherwise it may be bigger. Sorting on this column will sort by absolute value.
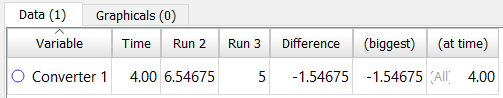
(at time) is the time at which the largest difference was found. If the values were unchanging in both runs the first time will be reported and it will say All in front:
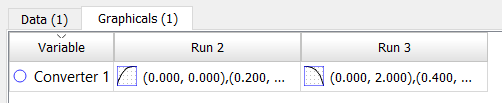
This displays the differences found in graphical values between the two runs. These change only if the graphical was edited, changed through import (Importing and Exporting Data) or overridden on a graph set up using Graph Settings Properties Panel or on using a Graphical input (Interface).
Variable is the name of the graphical variable for which the graphical values have changed. Click on this to open the the Results Panel You can sort on the variable name.
First run name (Run 1) shows the graphical in the first run. This column is not sortable.
Second run name (Run 2) shows the graphical in the second run. This column is not sortable.
When you click on a row, the x,y values for the graphical will be displayed:
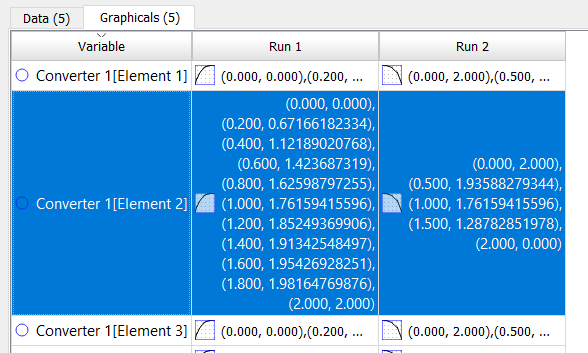
Exporting will also display information with this detail, though everything will be tab delimited to allow easy pasting into a spreadsheet.
Note Variables that show up in the Graphicals tab are also likely to show up in the Data tab. The graphicals tab displays the definition change, the data tab the results change. For graphicals on time those changes will be the same.