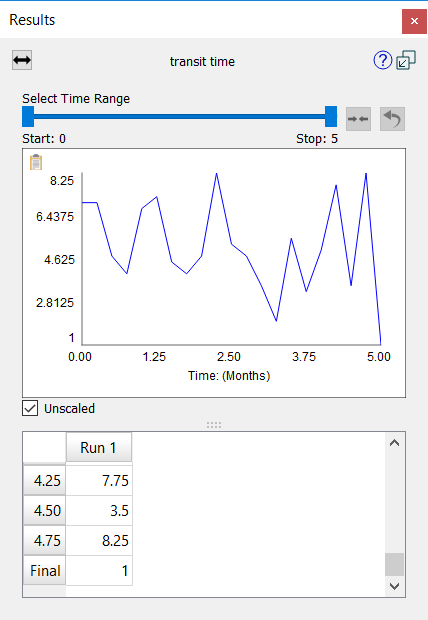
The results panel lets you see graphs of results from the model simulations you've made.
Use the Causes Uses button (![]() ) to navigate to causes and uses of the current variable. See Causes Uses.
) to navigate to causes and uses of the current variable. See Causes Uses.
Drag the handles of the slider (![]() ) to change the time range over which values will be displayed. You can Narrow this range are much as you like by dragging these handles toward one another. After doing this click on
) to change the time range over which values will be displayed. You can Narrow this range are much as you like by dragging these handles toward one another. After doing this click on ![]() to refine the granularity of the handle movement. Repeating this will allow you to view values at specific DTs. Click on
to refine the granularity of the handle movement. Repeating this will allow you to view values at specific DTs. Click on ![]() to view values for the entire run.
to view values for the entire run.
Note If the Causal Lens™ is open when you first open the Results Panel the time range will be set as it is in the Causal Lens.
In explore mode when the results panel is open on a constant, there will be an editing box to change the constant:

Type in a value and pres the Enter key or click on Submit. The model will run with the value you enter. Click on ![]() to put the constant back to its model value. The value you set will be temporary, no changes will be made to the model equations.
to put the constant back to its model value. The value you set will be temporary, no changes will be made to the model equations.
If you open the Results Panel on a variable that is a graphical, a button will appear at the bottom:

Click on this to open the Graphical Editor dialog box and make changes to the graphical. The changes will be temporary, and can be reset by opening the graphical editor again and clicking on reset, or by a restore inputs or reset all devices command.
For more information on working with the Results panel, see Results Panel