The following images illustrate how you can transform an existing model into a hybrid causal loop diagram.
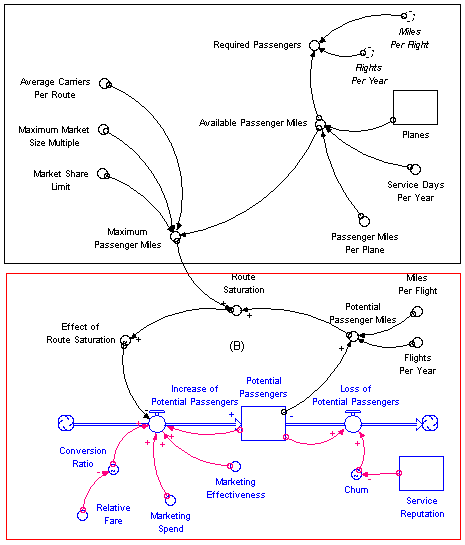
Suppose you have created the following model:

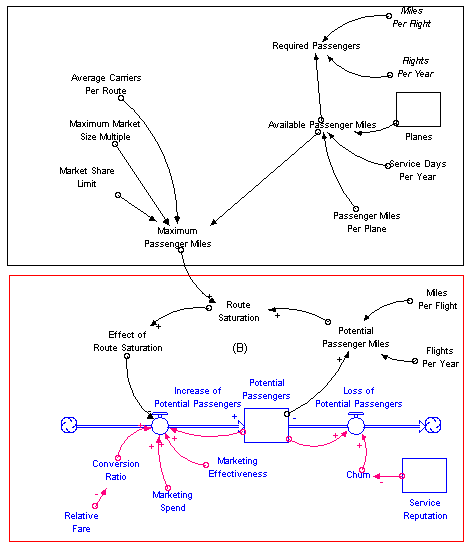
If you have a complex model like this, you might want to simplify it to show only the dominant feedback loops as a Causal Loop Diagram (CLD). You can do this by first selecting Name only as the converter type in the Model Preferences dialog. This simplifies your model to look like this:

You may also want to more clearly indicate the feedback loops by assigning polarity (+/s or -/o) to the connectors and flows, as shown above. The center of the balancing feedback loop in the above model is indicated by inserting a text box that contains a "B" (for "balancing") and clicking the Format for CLD button in the Text Box dialog box.
For a simple model, just using Name only converters and polarity may be enough to create a CLD. For a more complex model like the one shown above, however, you may want to select only the dominant feedback loops to present as a CLD. The first step to converting a model with multiple feedback loops into a CLD is to create a storytelling button on the Interface layer and to build a story that contains only the elements you want to include in the CLD.
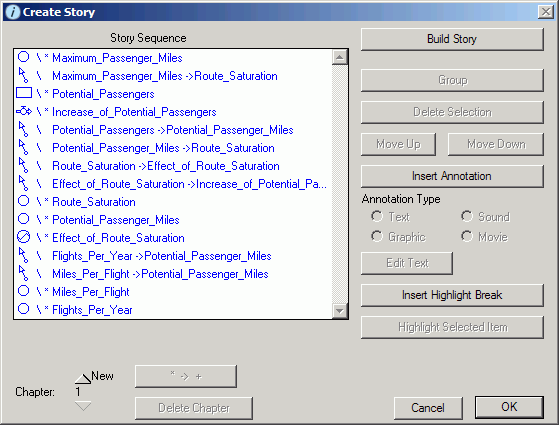
The following image shows what the Create Story dialog box looks like for the model shown above.
Note: Selected elements in the image below are indicated with an asterisk (*).

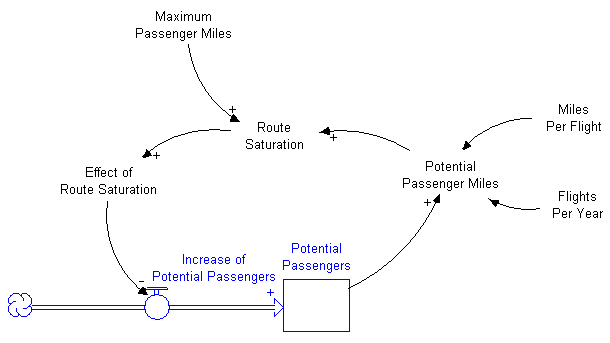
When you click the storytelling button you've created, the resulting CLD appears on the Storytelling tab:
