The results panel lets you see graphs of results from the model simulations you've made. To open it:
From the Model menu, select Open Results panel
or
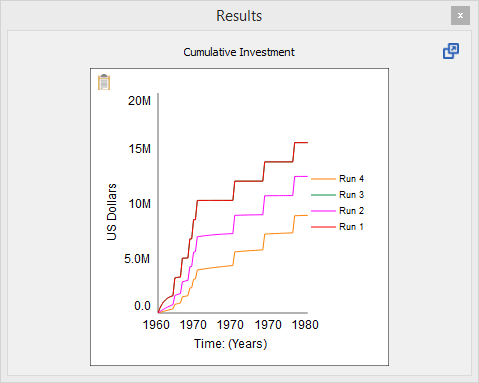
The results panel will open:
The results panel displays comparative graphs for any variable you select. You can also set it to display only the most recent run in the Model Settings Properties Panel.
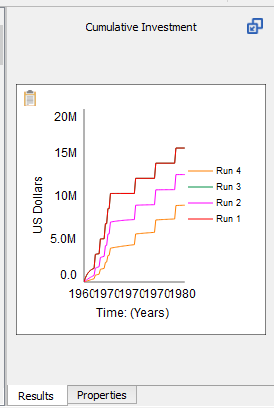
The Results panel is a dockable panel. You can dock it to the left or right of the main window, or leave it floating. In Edit mode, when the Properties panel is also open, you can dock the results panel to sit above the Properties panel, sit below it, or share the same area. You do this by dragging the Results panel to the top, bottom, or middle of the Properties panel, respectively. As you drag it, the target area for it to dock to will be highlighted.
When the Results and Properties panels overlap, a tab is added to switch between them.
You can set constant values in the results panel as long as Show inputs in Results panel is checked in the Preferences Dialog and you're in Explore mode. When you select a constant, the panel will display an entry for the value.
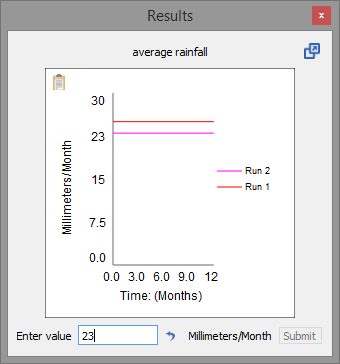
To change the value, type in a new value and click the Submit button (or press the enter key). To reset the value to the model equation value, click on the ![]() button.
button.