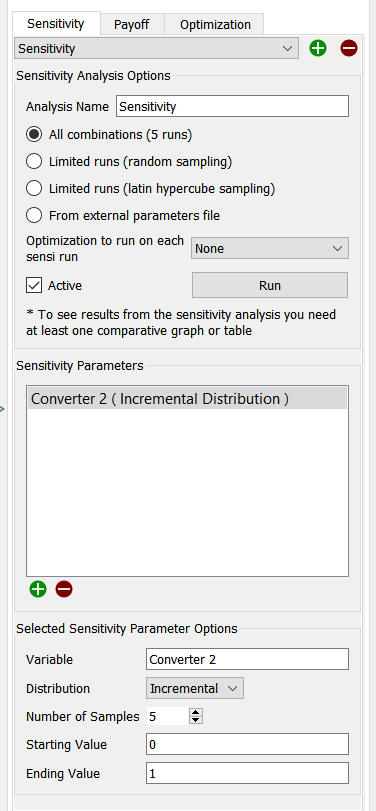
Use the Sensitive Specs panel to enable sensitivity analysis and to specify the variables you want to use for it. For more information on sensitivity analysis, see performing sensitivity analysis.
To open the Sensitivity Specs panel click on the Model Analysis Tools ![]() tab of the properties panel (with nothing selected in your model). Then click Sensitivity on the tabs that appear at the top. You can have one or more Sensitivity definitions. By default the first is called Payoff, but you can change this name.
tab of the properties panel (with nothing selected in your model). Then click Sensitivity on the tabs that appear at the top. You can have one or more Sensitivity definitions. By default the first is called Payoff, but you can change this name.
The name appears in the dropdown. If you have defined multiple sensitivities, use the dropdown to select the one you want to edit. Use ![]() to add a new sensitivity definition and
to add a new sensitivity definition and ![]() to remove the current definition.
to remove the current definition.

This uses the settings for each variable to determine the total number of runs. For each of the parameters the values are determined, then all combinations of those values are used. The total number of runs is the product of the number of runs for every different parameter.
This lets you specify the total number of runs directly. For more information on specifying the number of runs, including information on Ad Hoc and Incremental distributions, see Selecting Sensitivity Analysis Distributions.
In Latin Hypercube points are drawn without replacement from the distributions of each of the input variables. This guarantees that the full range of the distribution will be sampled for every parameter and, with the exception of incremental and ad-hoc inputs, there will be no repetition of the ranges. This allows you to achieve the maximum variation with the minimal number of simulations.
From External Parameter File, if checked, will bring in a sequence of values for different parameters from a files. Once checked, there will be browse button to choose a file:

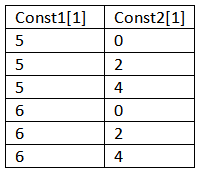
If the file you choose is an Excel file you will see a dropdown for the sheet to use. The input format is the same as it is for all import files with a list of full subscripted variables names in the first row or column and a series of values in the associated column or row. For example:

If parameter values can be read from the sheet the number of runs will be displayed and the Run button show. If not, click on Show Errors to see why it failed to read values.
Optimization to run allows you to specify an optimization to be performed for each sensitivity run made. If this is set then the sensitivity parameters for the run will be selected, then an optimization will be performed, and a run will be made using the results of that optimization. Select None to run regular sensitivity analysis.
Note If the optimization set up you have selected has sensitivity set, that setting will be ignored. Similarly, if an optimization is run using a sensitivity setup that references an optimization that reference will be ignored.
Active indicates that this is the sensitivity definition that will be used by the model when a sensitivity is run. Only once sensitivity definition will be active at a time. Unchecking this will deactivate sensitivity, so that S-Run will not appear in the toolbar. Clicking the Run button will activate the current definition.
This performs a sensitivity analysis. This is available once you've specified, at a minimum, the number of runs to make. You can also run sensitivity analysis from the menu or the Run toolbar. If this is not available the button will be labeled Show Issues and clicking on it will provide a message explaining why Run will not work.
This displays a list of variables to be changed in the sensitivity runs. The list can be empty, normally for those models with equations that use statistical Builtins that have no seed specified. To edit something in the list, click on it. To remove it, click on it and then click on ![]() . To add something to the list, click on
. To add something to the list, click on ![]() and complete the remaining fields.
and complete the remaining fields.
This lets you specify which variable (it has to be a constant converter, a constant flow, or a stock with a constant initial value equation) to use and what values it will take on.
Variable lets you specify which model variable to use. Begin typing (you'll be prompted with autocomplete), drag a variable from the Find dialog, or Ctrl-drag (⌘-drag on Mac) a variable from the model.
Distribution lets you choose the distribution to be used for the named variable. For more information, see Selecting Sensitivity Analysis Distributions.
The remaining entries in the panel depend on the distribution you've chosen. For all the statistical distributions you can specify a seed, and for some distributions, you can specify additional values. For Ad Hoc, you specify a list. For Incremental, you specify a minimum and a maximum. If you've selected "All combinations" above, there will also be an entry for the Number of Samples for all but the Ad Hoc distribution.
Note: If you're using random distributions, be sure to specify a different noise seed for each.