Use the causal lens to see the behavior of a variable, and the things that contribute to that variable's behavior. The Causal lens displays a comparative graph with raw scaling, so you can see what changed and when it changed, as clearly as possible.
To open the Causal Lens, select Open Causal Lens from the Window menu, or click on ![]() in the toolbar. If you're currently editing a variable, it will open on that variable; otherwise, you'll be asked which variable to open on. If the current variable is arrayed, you'll be asked to select an element.
in the toolbar. If you're currently editing a variable, it will open on that variable; otherwise, you'll be asked which variable to open on. If the current variable is arrayed, you'll be asked to select an element.
The Causal Lens will open:
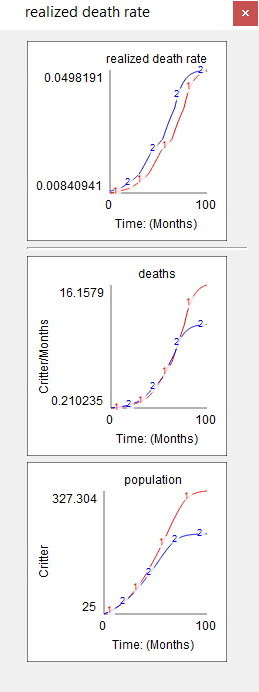
This shows a variable, and the other variables that cause it. If there are a large number of causes, there will be a scroll bar to make all of them visible. For flows, implicit causes that result because of non-negativity or capacity constraints will be shown.
You can scrub across a graph by dragging. As you do this, the values for all the graphs will be displayed.
Click on any of the causes to see its causes in turn. The graphs will appear to the left. The graph you clicked on will remain highlighted to help you visualize the path of causality.