Sensitivity analysis allows you to have the software run a model multiple times with varying initial variable values, so you can compare the run results against each other.
When you set up sensitivity analysis for a variable, you select a distribution in Sensitivity Specs. The choices are:
The procedures for using each option are described below.
Type, or paste, a comma delimited list of values. The number of entries in this list determines the number of simulations that will be made. If you've specified the number of simulations, then either a subset of the list will be used or the list will be repeated as necessary to complete the number of runs specified. For example, if 5 runs are specified and the list is 1,2,3 then the values used would be 1,2,3,1,2.
In addition to comma delimited values, you can also enter tab delimited values, or one value on each line.
Tip: You can copy and paste rows or columns of numbers from a spreadsheet into the list of values.
Select the Incremental option to automatically assign values that are evenly incremented between the start and end values you specify, distributed over the number of runs you specify.
Specify a starting and ending value by filling in the corresponding edit boxes. If you've specified All combinations at the top of the panel, you'll also have a place to enter the number of runs.
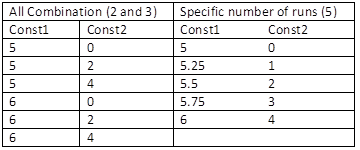
If you only specify a single variable, you'll get the same results whether you asked for a Specific number of runs or All combinations. If you have multiple variables, you'll get different results, as illustrated below. In this case, Const1 has a minimum of 5 and maximum of 6, while Const2 has a minimum of 0 and maximum of 4.

The remaining distribution choices draw random numbers based on the selected distribution. For these distributions, the only difference between selecting All combinations and a Specific number of runs is the way that the number of runs is computed. In all cases, a new random number is drawn for each successive run.
IMPORTANT: If you have multiple variables using random distributions, choose a different seed for each of them, to prevent correlation. The same seed and distribution will give the same values.
The distributions available are the same as those for the Statistical builtins. When you select a distribution, the parameters to that distribution will be displayed. Both the number and names of the parameters vary by distribution. For a Normal distribution, you specify a mean and standard deviation. For a Uniform distribution, you specify a minimum and maximum.