Use the Data Manager to save model runs for use later on, to reorder runs, to load parameters from earlier runs and to load runs from external data sources.
To open this dialog box, choose Data Manager from the Model menu, or click on the ![]() button on the Run toolbar. You can also click on Manage Comparative Data in the panel for comparative graphs and tables.
button on the Run toolbar. You can also click on Manage Comparative Data in the panel for comparative graphs and tables.
Note: If the model hasn't been run, there will be no action that can be taken in the Data Manager other than importing a run from an external source.
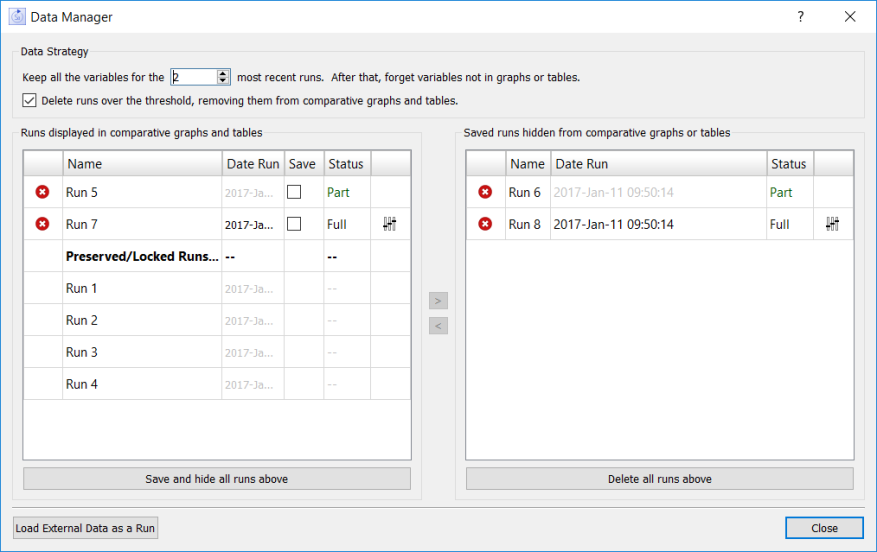
The data strategy you select determines how many runs will be kept before they roll off of the list and what will happen to comparative graphs and tables when runs do roll of the list.
Note All variables will be kept only if Keep all variable results has been checked in the Model Settings Properties Panel
Delete runs over the threshold..., if checked, will cause any runs beyond the threshold specified above to be completely deleted. If this is not checked, and you have any comparative graphs or tables, these runs will only be partially deleted, and the values from them will continue to be displayed in the comparative graphs and tables. Unchecking this means that comparative graphs and table will simply keep adding results until you restore results. Checking it, as it is now, will drop runs past the threshold.
Note When you perform a sensitivity run the software will act as if you unchecked the above checkbox for the duration of the sensitivity run, then change back to the checked behavior for the next run. You might for example normally see 2 runs, then see 4 after running sensitivity, then see two again after a normal run.
This is a list of runs that will be displayed in any comparative graphs or tables including the Results Panel
and Causal Lens™. You can reorder this list (except as noted below) by dragging the row to a different position. You can also drag a row to the list on the right. For row in the list there are a number of actions you can take by clicking or double clicking at the appropriate location.
Save and hide all runs above moves everything in the list to the list on the right. It is the equivalent of dragging each of them across. Runs below the Preserved/Locked Runs line will not be affected.
Note For graphs and tables that are not comparative, the last run in the list (or the last run before the Preserved/Locked Runs line if that is displayed) will be used. To see the results from a run drag it to that position.
Note If the last run in the list is not Full, then many graphs and tables may simply appear blank.
This list acts as a holding area for runs that you want to keep but for which you do not currently want to look at results. To see the results in one of these runs drag it to the list on the left.
Saved and hidden runs have the same set of actions as runs in the left list, except that they are saved by definition so there is no save checkbox.
Delete all runs above will delete all the runs in the list and remove them from the list. This action can't be undone. If there are graphs or tables that explicitly reference one of the runs in the list that run will appear in the left window below the Preserved/Locked Runs line.
Use the Load External Data as a Run button to bring data into a model so you can compare then with simulation results. After clicking on the button you will see a file selection dialog. Choose the files (and sheet if it is an Excel file) you want to import. You can select excel or csv format files.
The format for the data files are the same as the export format described in Setting Up Export Links. If you select vertical as the orientation, the first column must be Time or the time units of the model (eg Month), with time value on the rows below. Each additional column must contain a variable name with values for each time below. Arrays must be fully specified. If you select horizontal, it is the same format but the first two must be time and successive rows the variables with values.
After you select file and orientation the software will attempt to process the file and find the variables that match those in the model. You will receive a warning for each mismatch, and an error if there were no variables found or if there was a problem processing the time column or row.
When successful, the data are loaded into a run with the same name as the file (you can change this name by double clicking on it). Any comparatives (again including the Results panel and Causal Lens) will display what was in the imported file.
You can import values from anywhere in this manner. This includes values exported from running other models allowing cross model comparison.